How to Get Backlinks With Guestographics
Written by Brian Dean

What’s the secret to getting authority links?
It’s not an easy question to answer.
But you probably know other people that are able to generate backlinks to just about everything that they publish.
How do they do it? Do they know some link building secret that you don’t?
Actually, yes, they do!
It may happen behind the scenes, but some people know how to get backlinks with ease.
I’m one of those people 🙂
And today I’m going to show you one of my favorite SEO strategies of all time: the Guestographic Method.
What Makes People Link To Other Sites?
As someone that’s sent thousands of link request emails, I can tell you that there’s a simple link building formula that works every time:
Great Content + Targeted Outreach + Added Value = Links
The first two parts of my little formula are pretty straightforward: publish great stuff and get it in front of the right people.
And that’s what most people do: they email hundreds of people, hoping that SOMEONE will link to them.
Sure, you can get a few backlinks that way…
…but you can easily double or triple your conversion rate by adding some value to the mix.
Link Building With Guestographics: A Mini-Case Study
Adding value is what the Guestographic Method is all about.
What is it?
It’s a link building technique that uses infographics in a new way.
Instead of publishing an infographic and begging other people to share it, you’re enticing them to publish it on their site…
…with a little bribe.
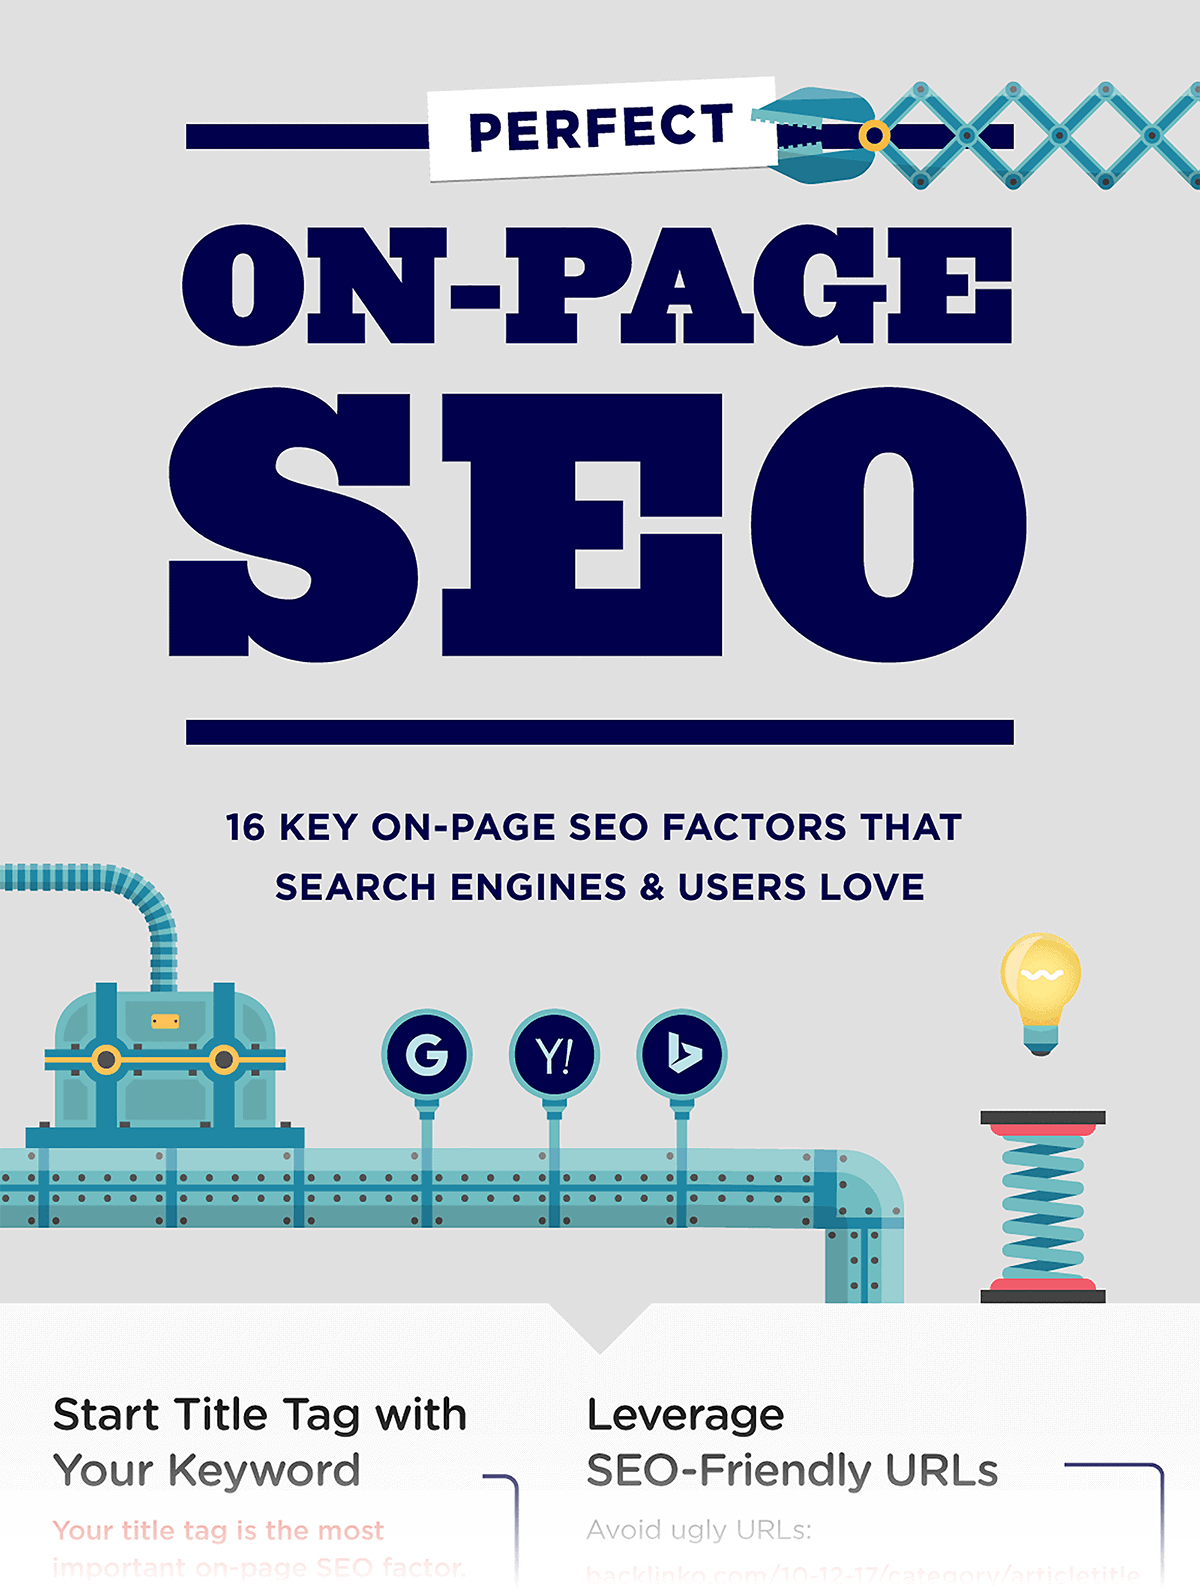
To show you how well this works, let me show you the results after using this technique with my on-page SEO post that used to include this infographic:
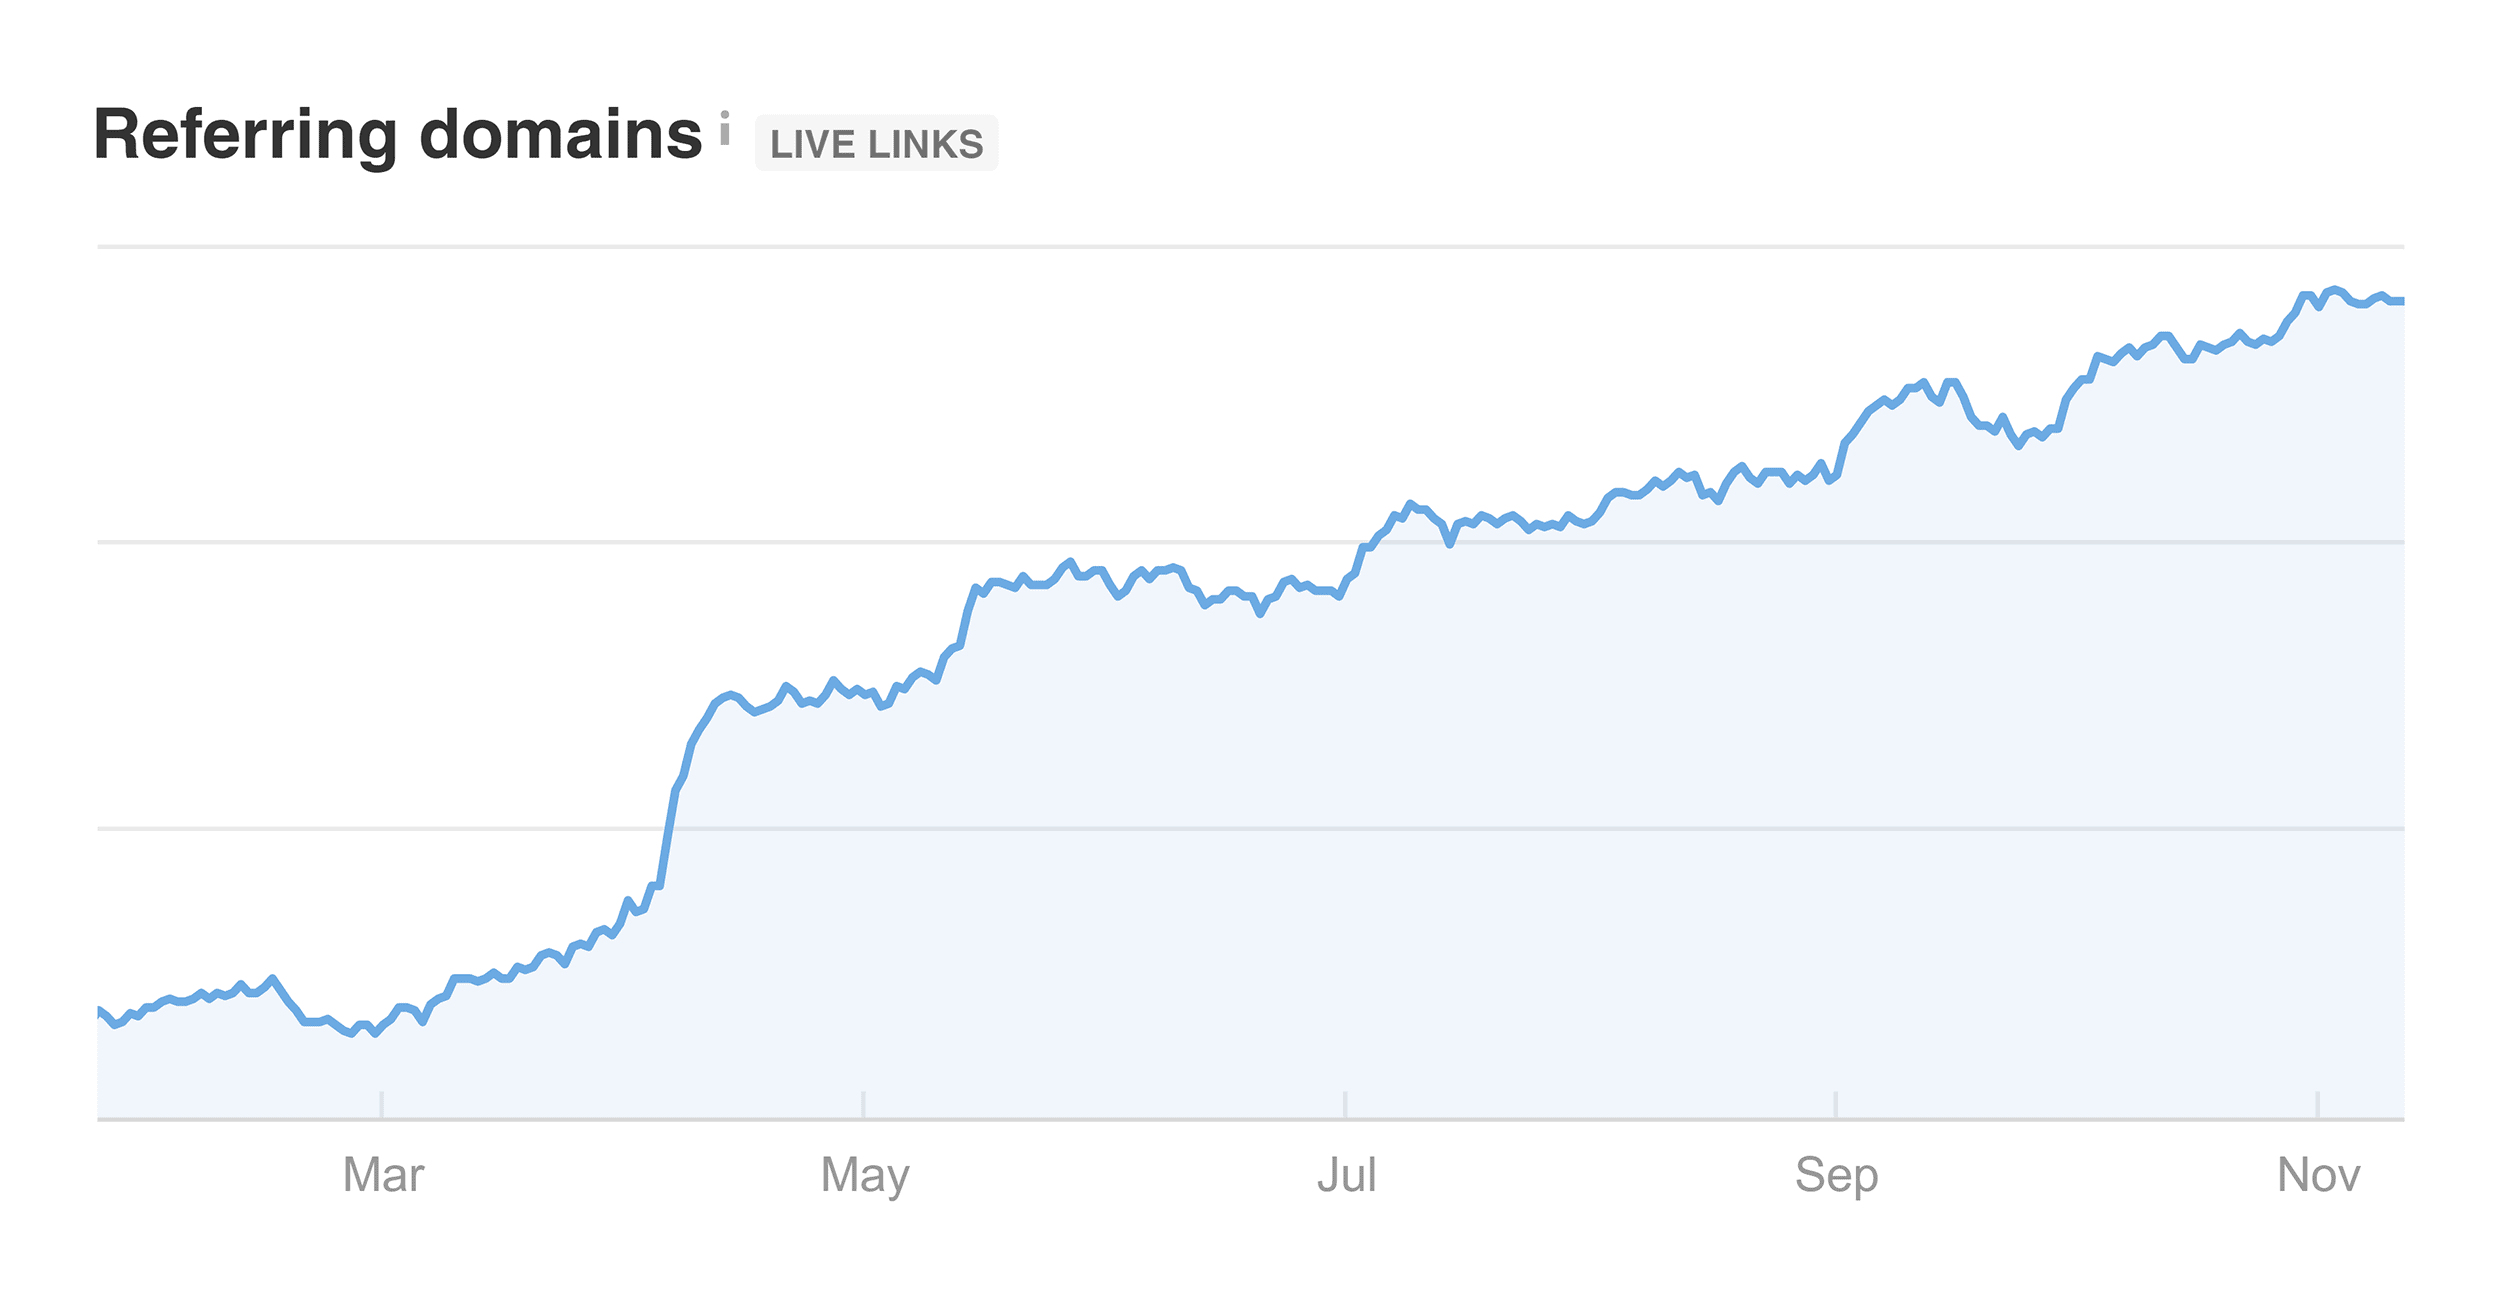
First, here’s the massive increase in referring domains pointing to that page:
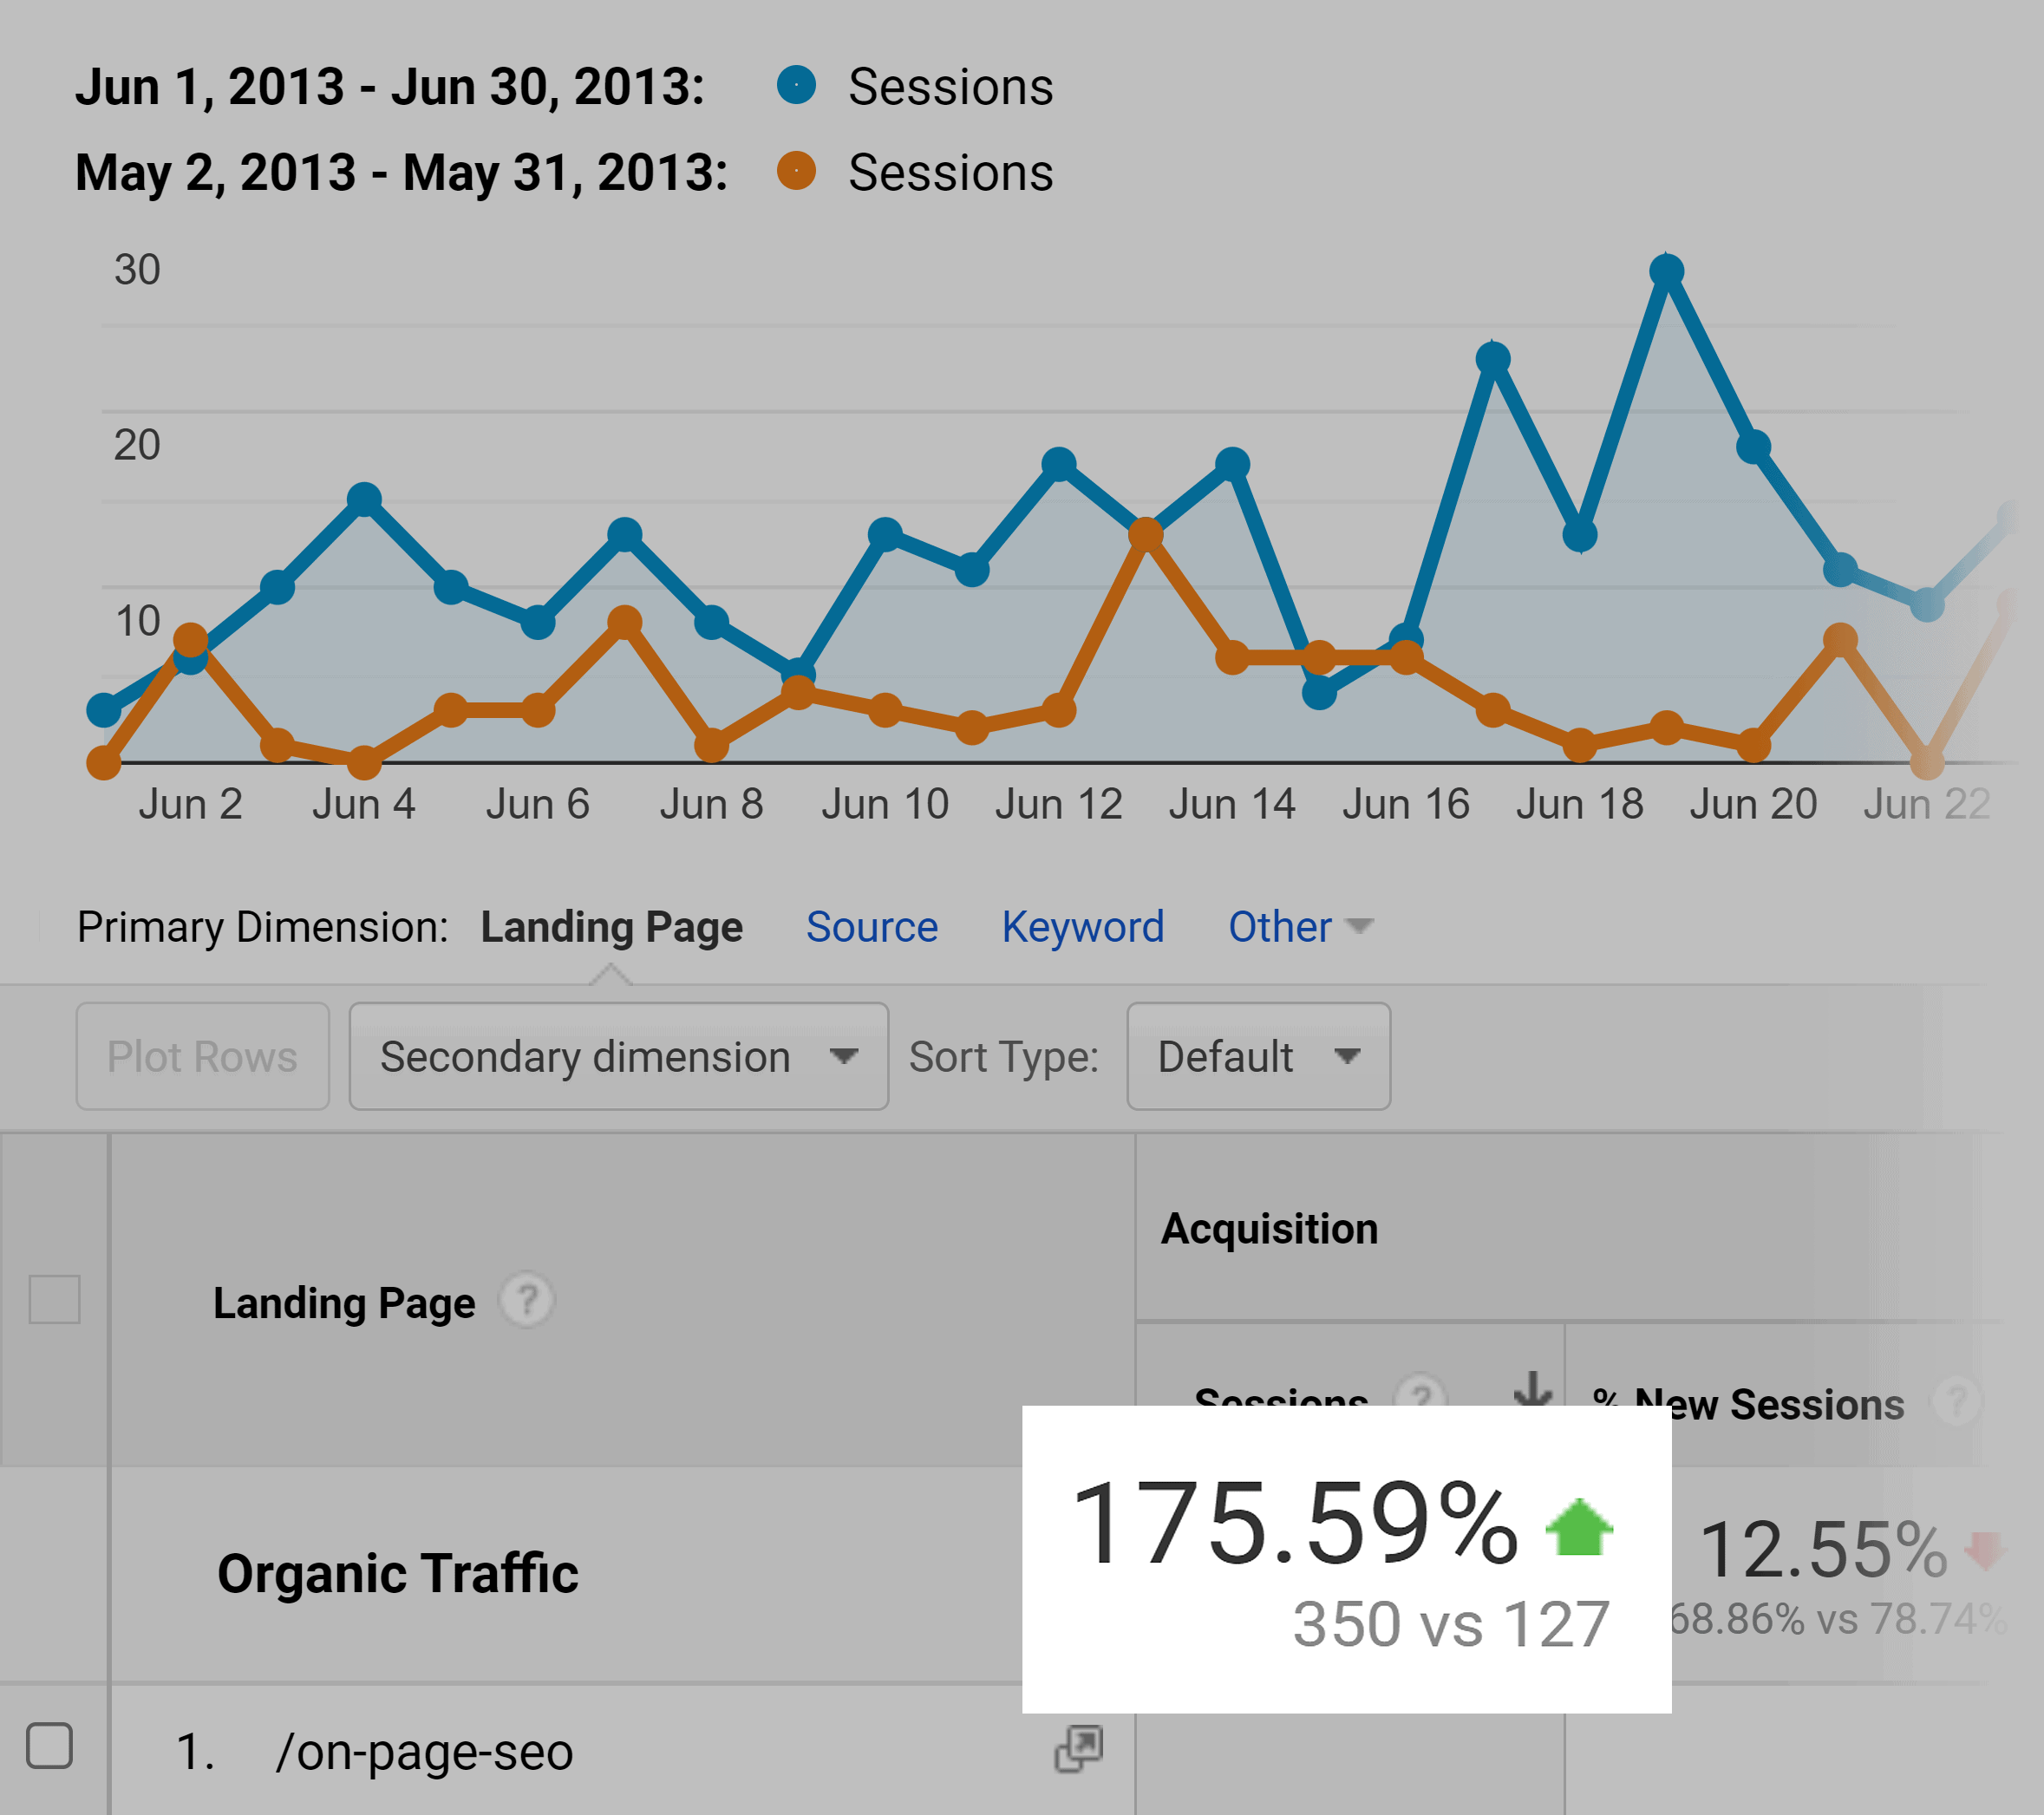
And organic search traffic to that page increased 175.59% vs. the previous month:
The page bounced between the 2nd and 3rd spot for the keyword “on page SEO”.
In short, it worked.
How to Get Backlinks Using Guestographics: 5 Simple Steps
The Guestographic Method couldn’t be easier.
Here are the five steps:
Step 1: Post an infographic on your site
Step 2: Find sites that write about your infographic’s topic
Step 3: Show them your infographic
Step 4: Offer them unique content (“the bribe”)
Step 5: Get your contextual backlinks
Let me show you each step in more detail…
Step 1: Publish an Awesome Infographic
There’s no shortcut here:
If you want people to share your infographic, it has to be good.
Fortunately, you don’t need a 6-figure marketing budget. In fact, my on-page SEO infographic only cost me $250.
Yes, the design is REALLY important.
But design is only ONE part of an infographic’s success.
So what really matters?
Actually, my upcoming premium SEO training course will teach you how to execute an infographic marketing campaign from scratch.
But I’ll show you some of the important points here to get you started.
1. A “Freshly Relevant” Topic
You need to pick a topic that’s what I like to call: “Freshly Relevant”.
Let me explain…
In my case, I noticed that people were publishing articles about on-page SEO every week…but they rehashed the same advice from 2003.
That told me that there was lots of demand for the topic…but no up-to-date content to meet that demand.
Another example:
Whenever a new social media network blows up, someone quickly bangs out an infographic about that network.
I’ve found that these infographics ALWAYS get a tidal wave of social shares, referral traffic, and backlinks.
Here’s one of the first infographics about Pinterest:
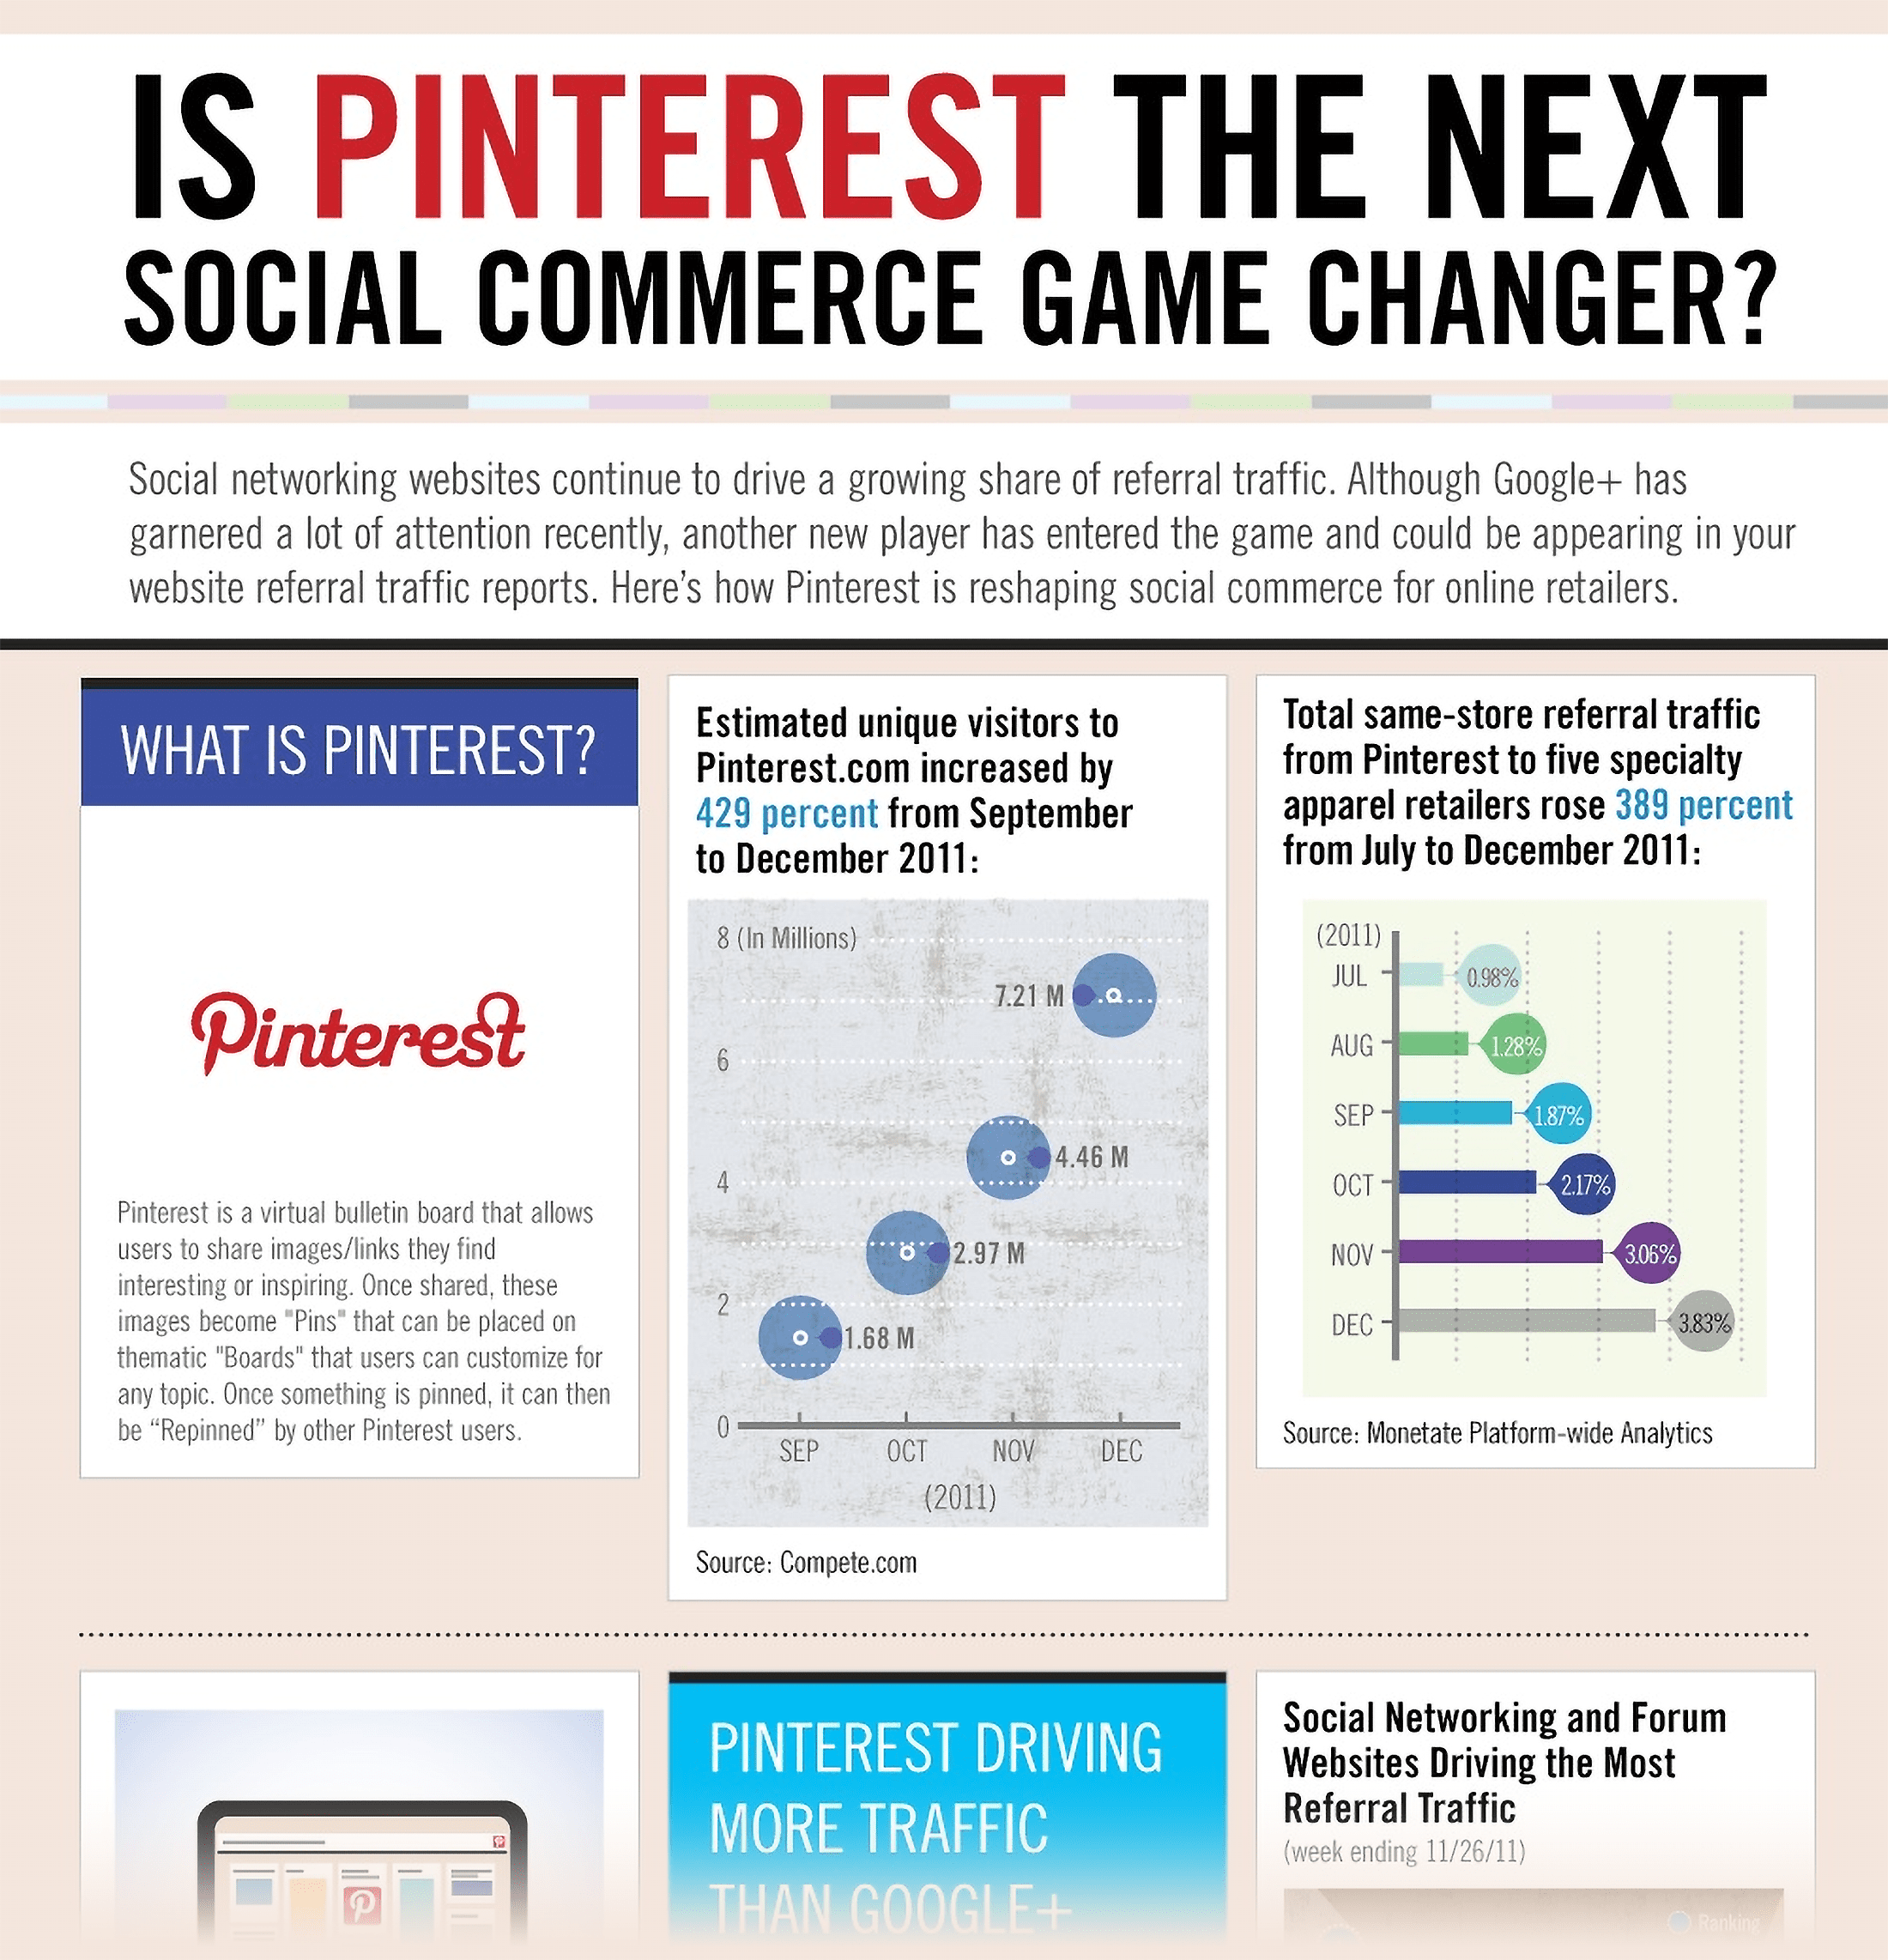
Not a bad design. But not amazing, either.
Now check out the link profile of the page that published it:

How could this be?
The authors of this infographic took a topic that gets a ton of attention (social media) but added a fresh twist (a new social media network).
And bingo! 173 referring domains.
2. Great Information (But Not Too Much)
You can look at an infographic like a visual blog post: the better the content, the better it performs.
So make sure that you’re VERY selective about what you include.
Neil Patel, who has published over 75 infographics, recommends that infographics should have no more than 7-10 data points.
This may not seem like a lot (because it isn’t).
And that’s the point: an infographic with 50 bits of data is hard to digest.
But a tightly-focused infographic that covers the most important info is really easy to remember.
And “easy to remember” means that it’s more likely to get shared and linked to.
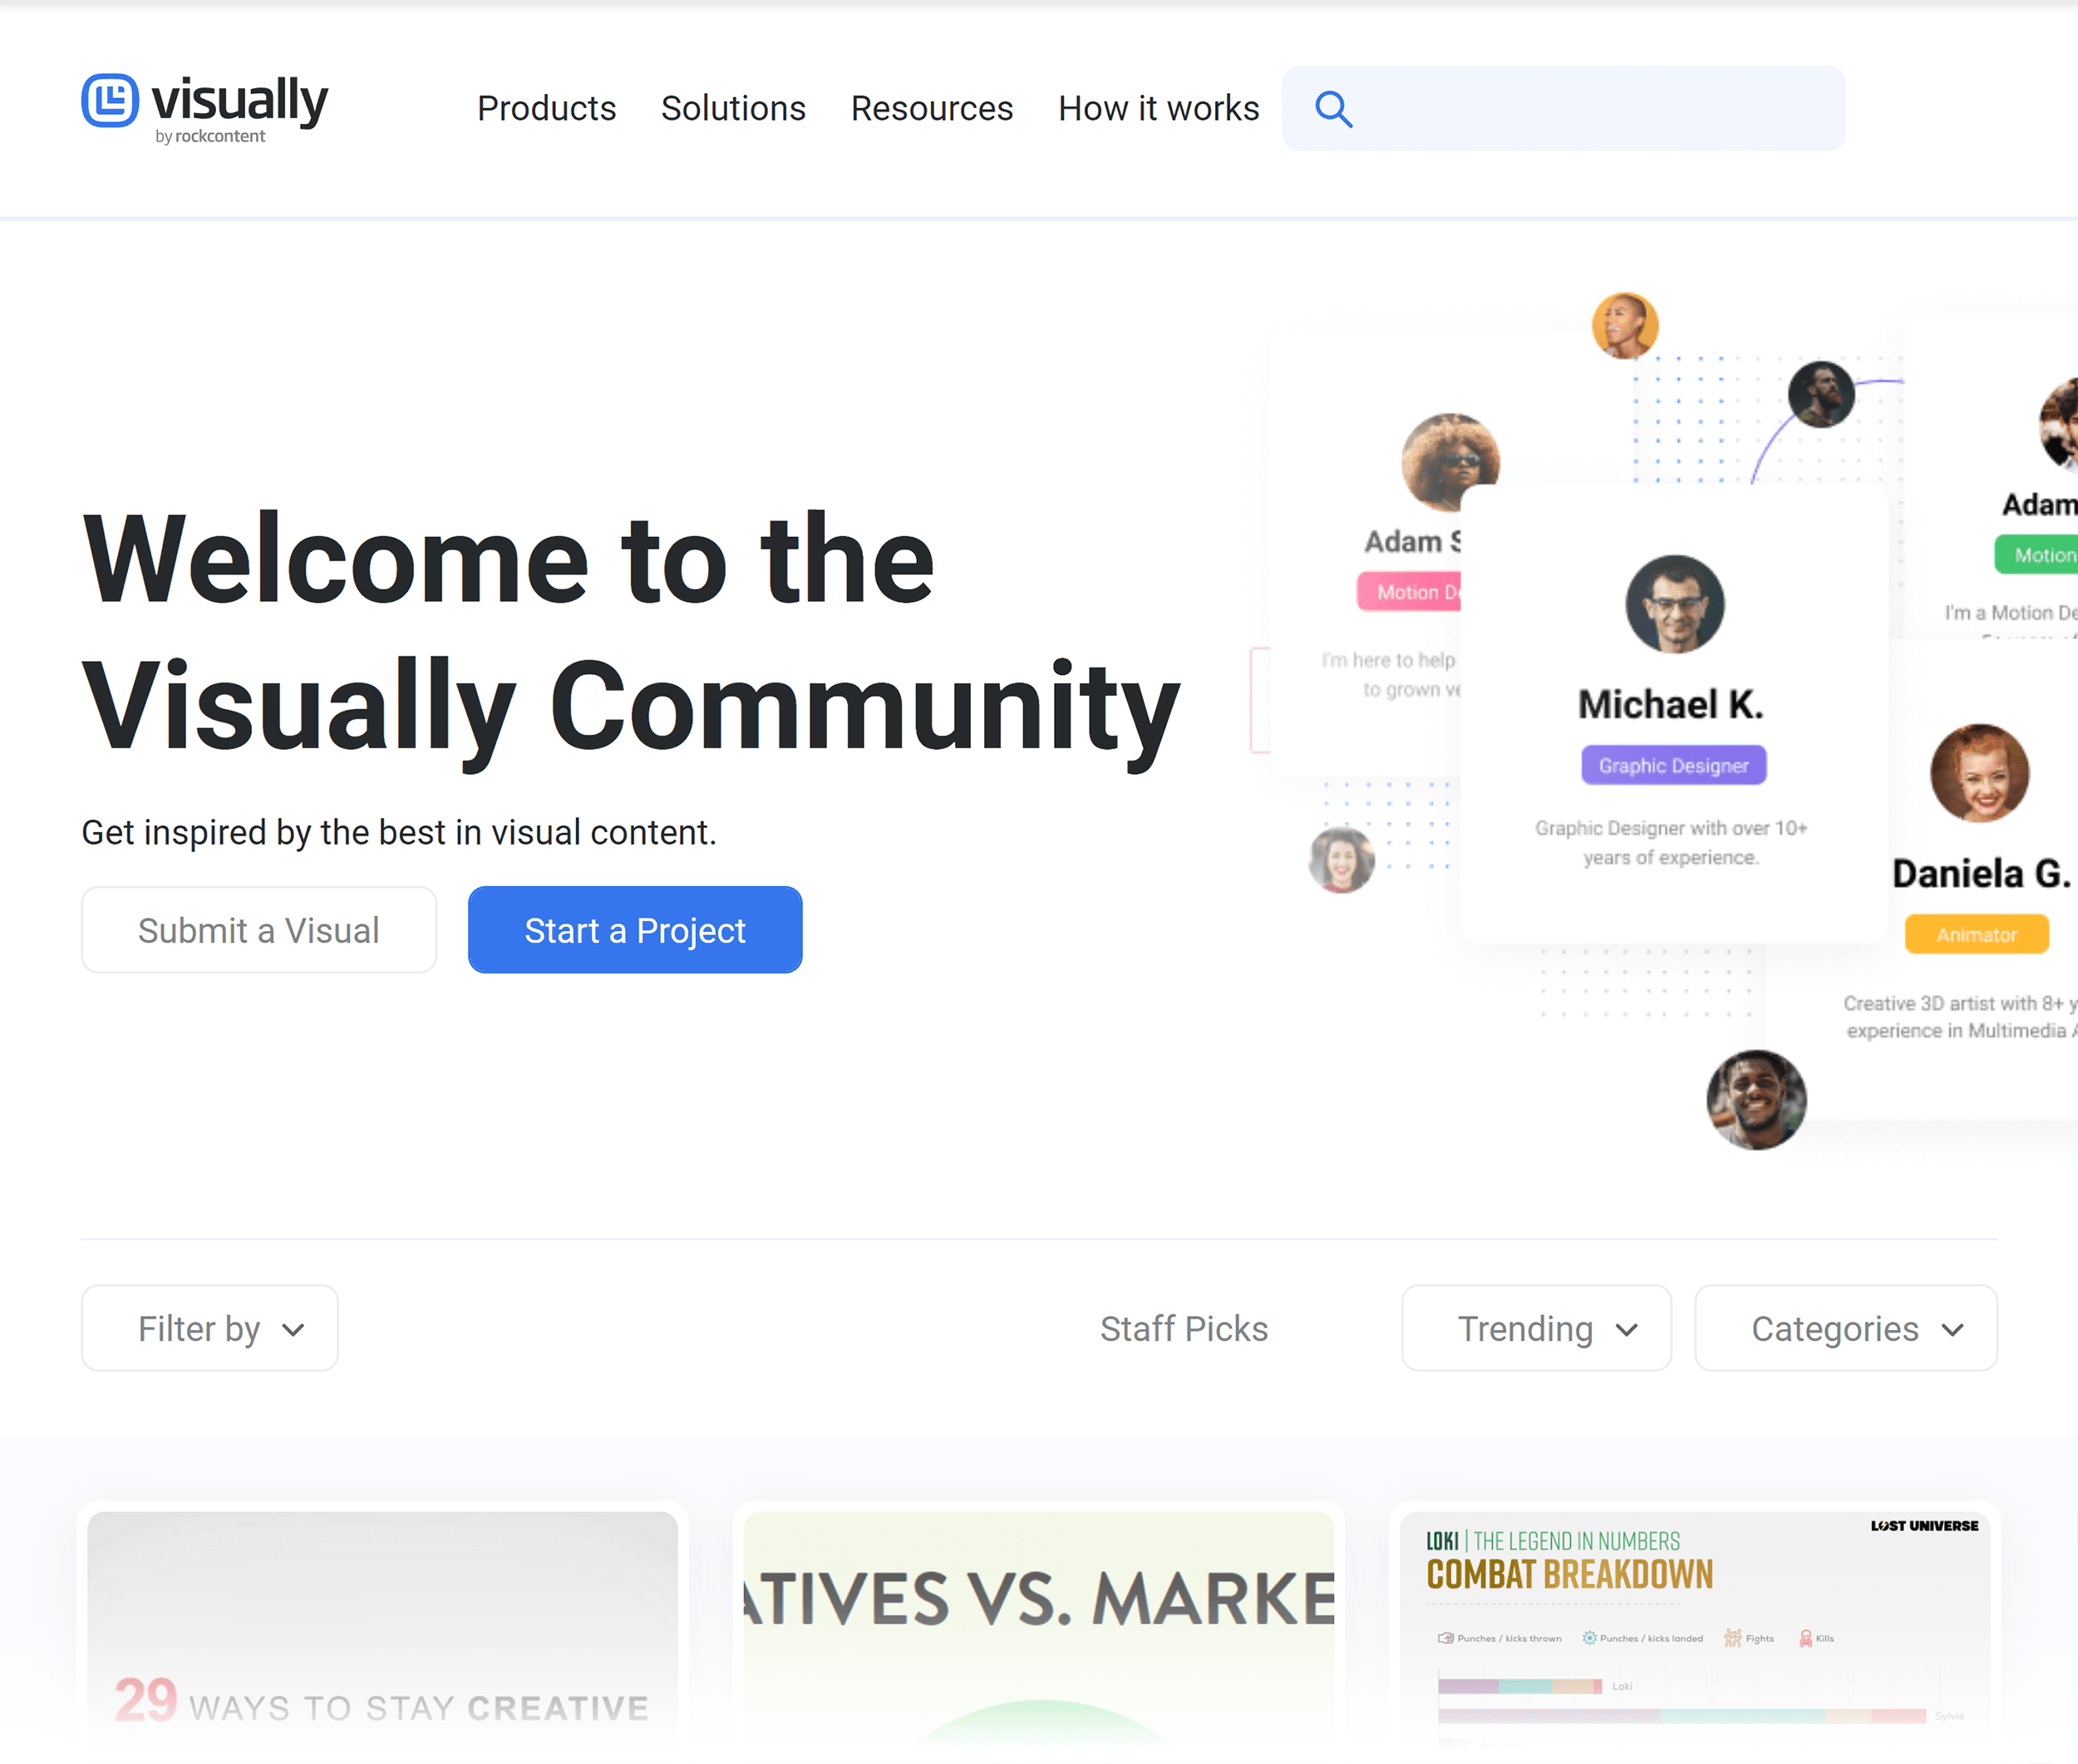
You can easily find infographic data at Visual.ly. Just search for infographics that have already covered your topic:
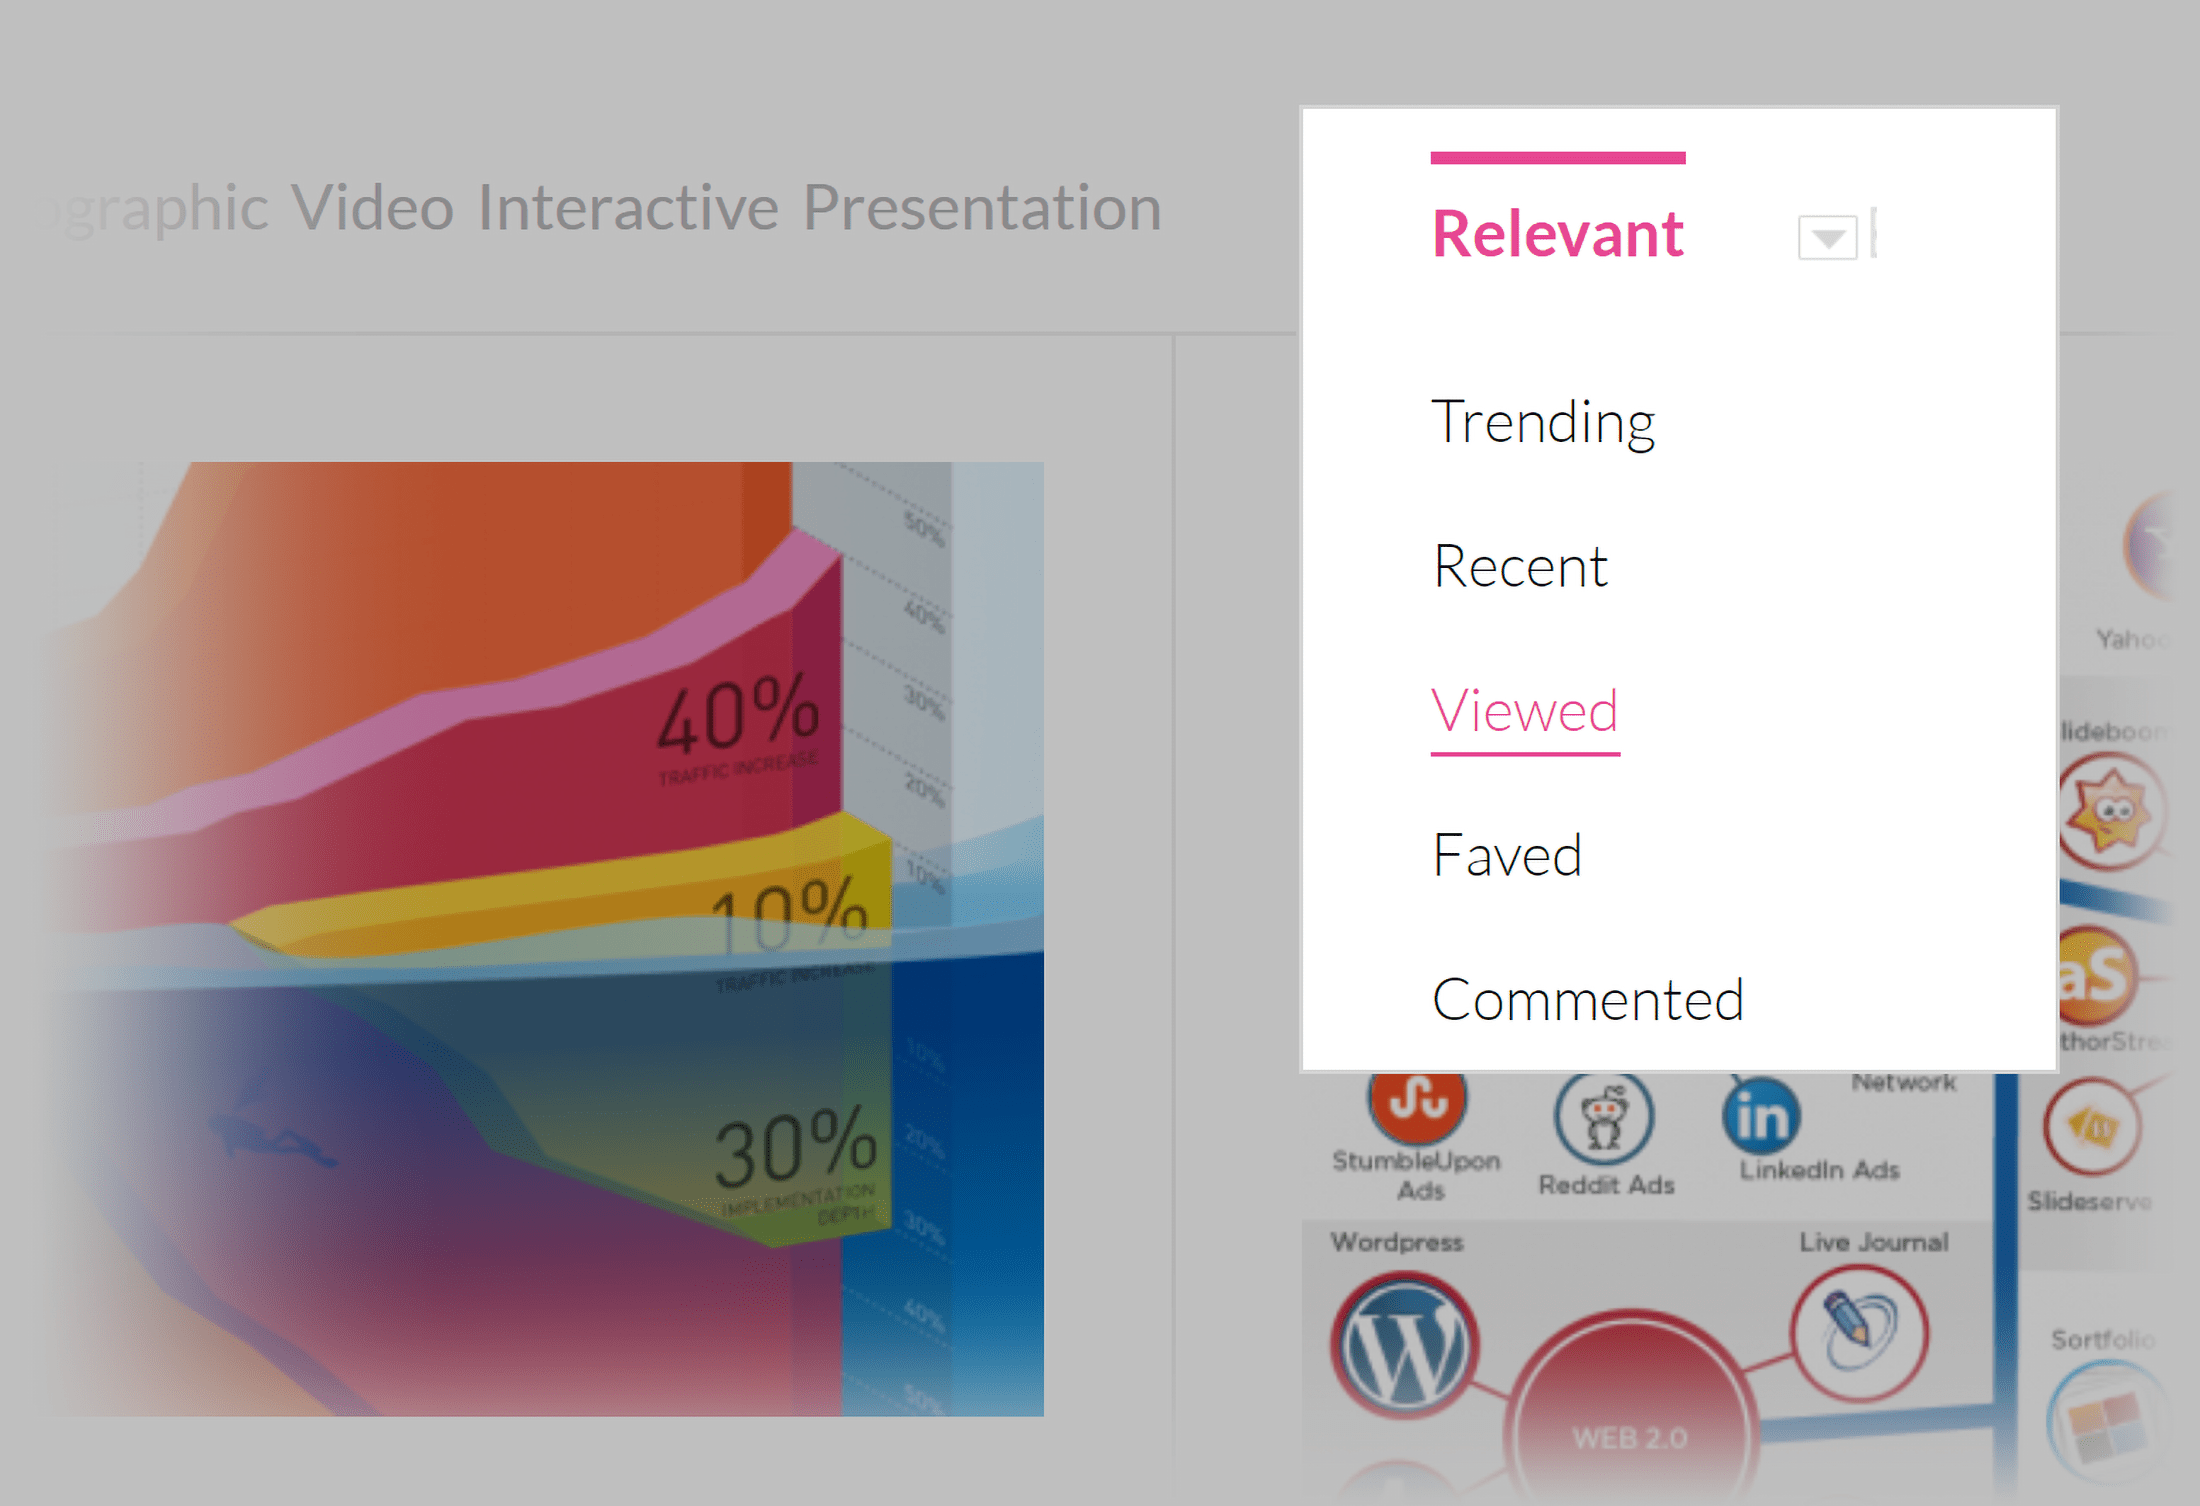
And sort by views or favorites:
And see if there are any infographic ideas you can use:
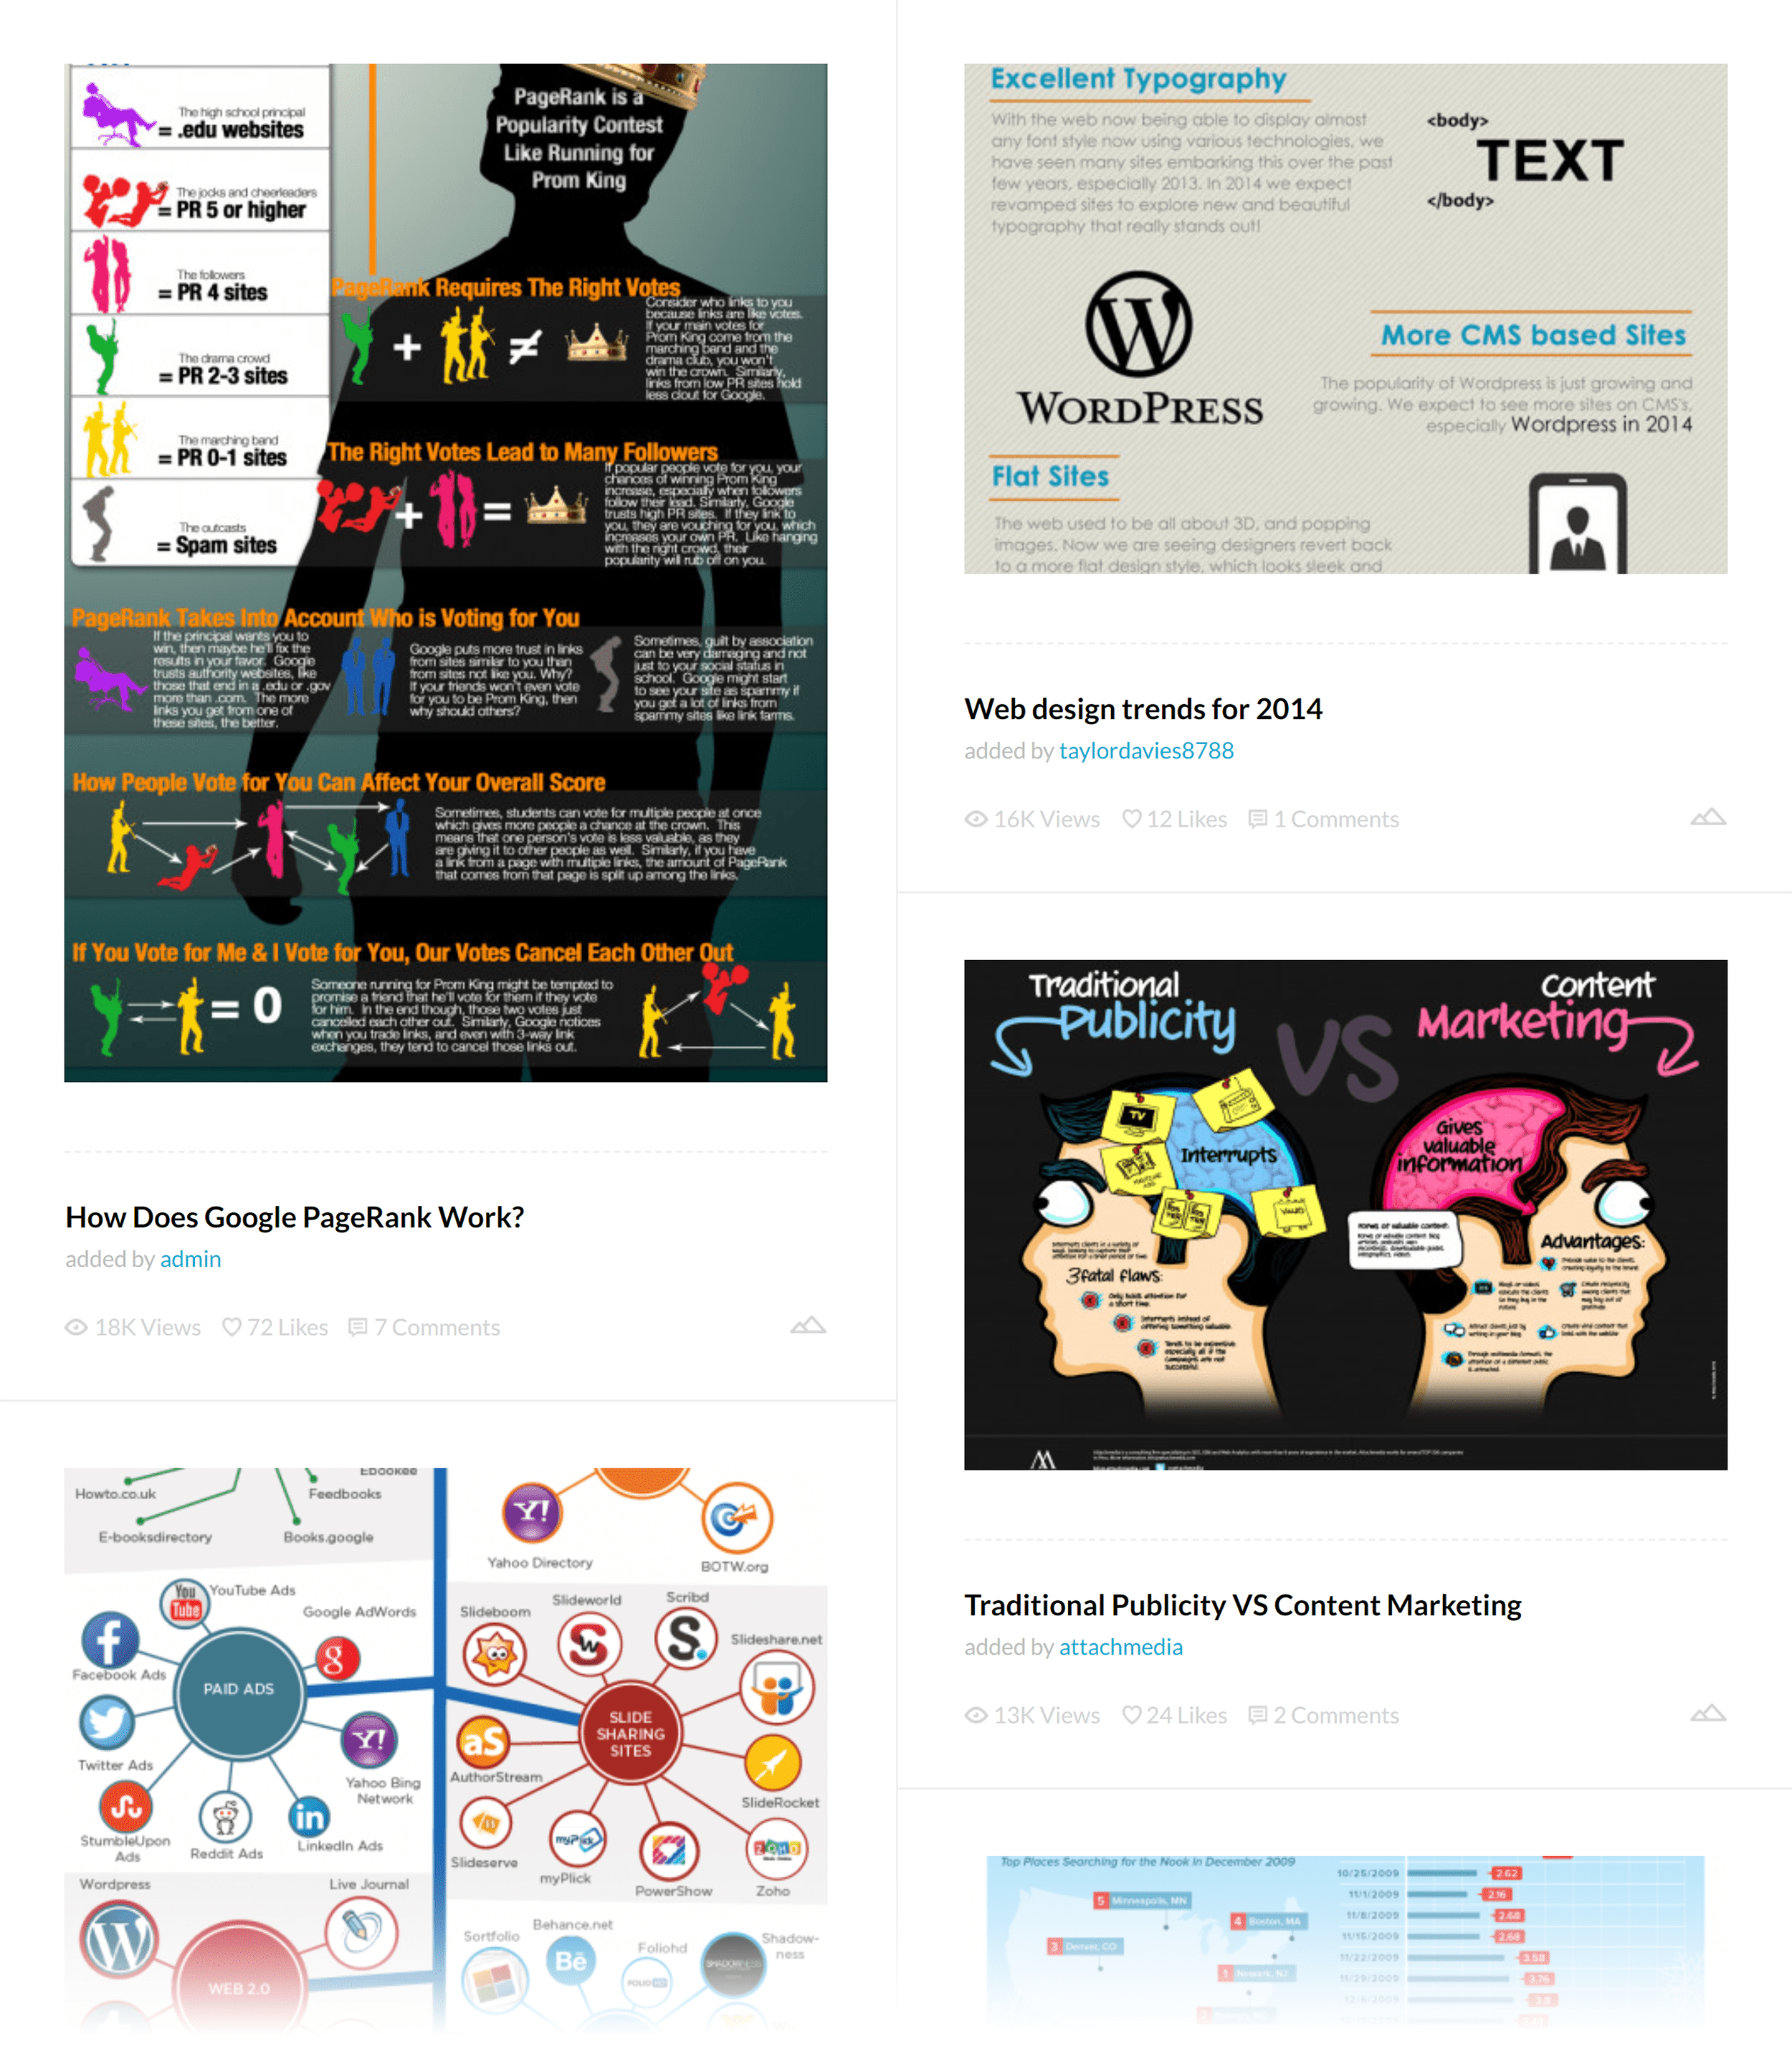
(Obviously, you should cite the infographics you use in the sources area of your infographic.)
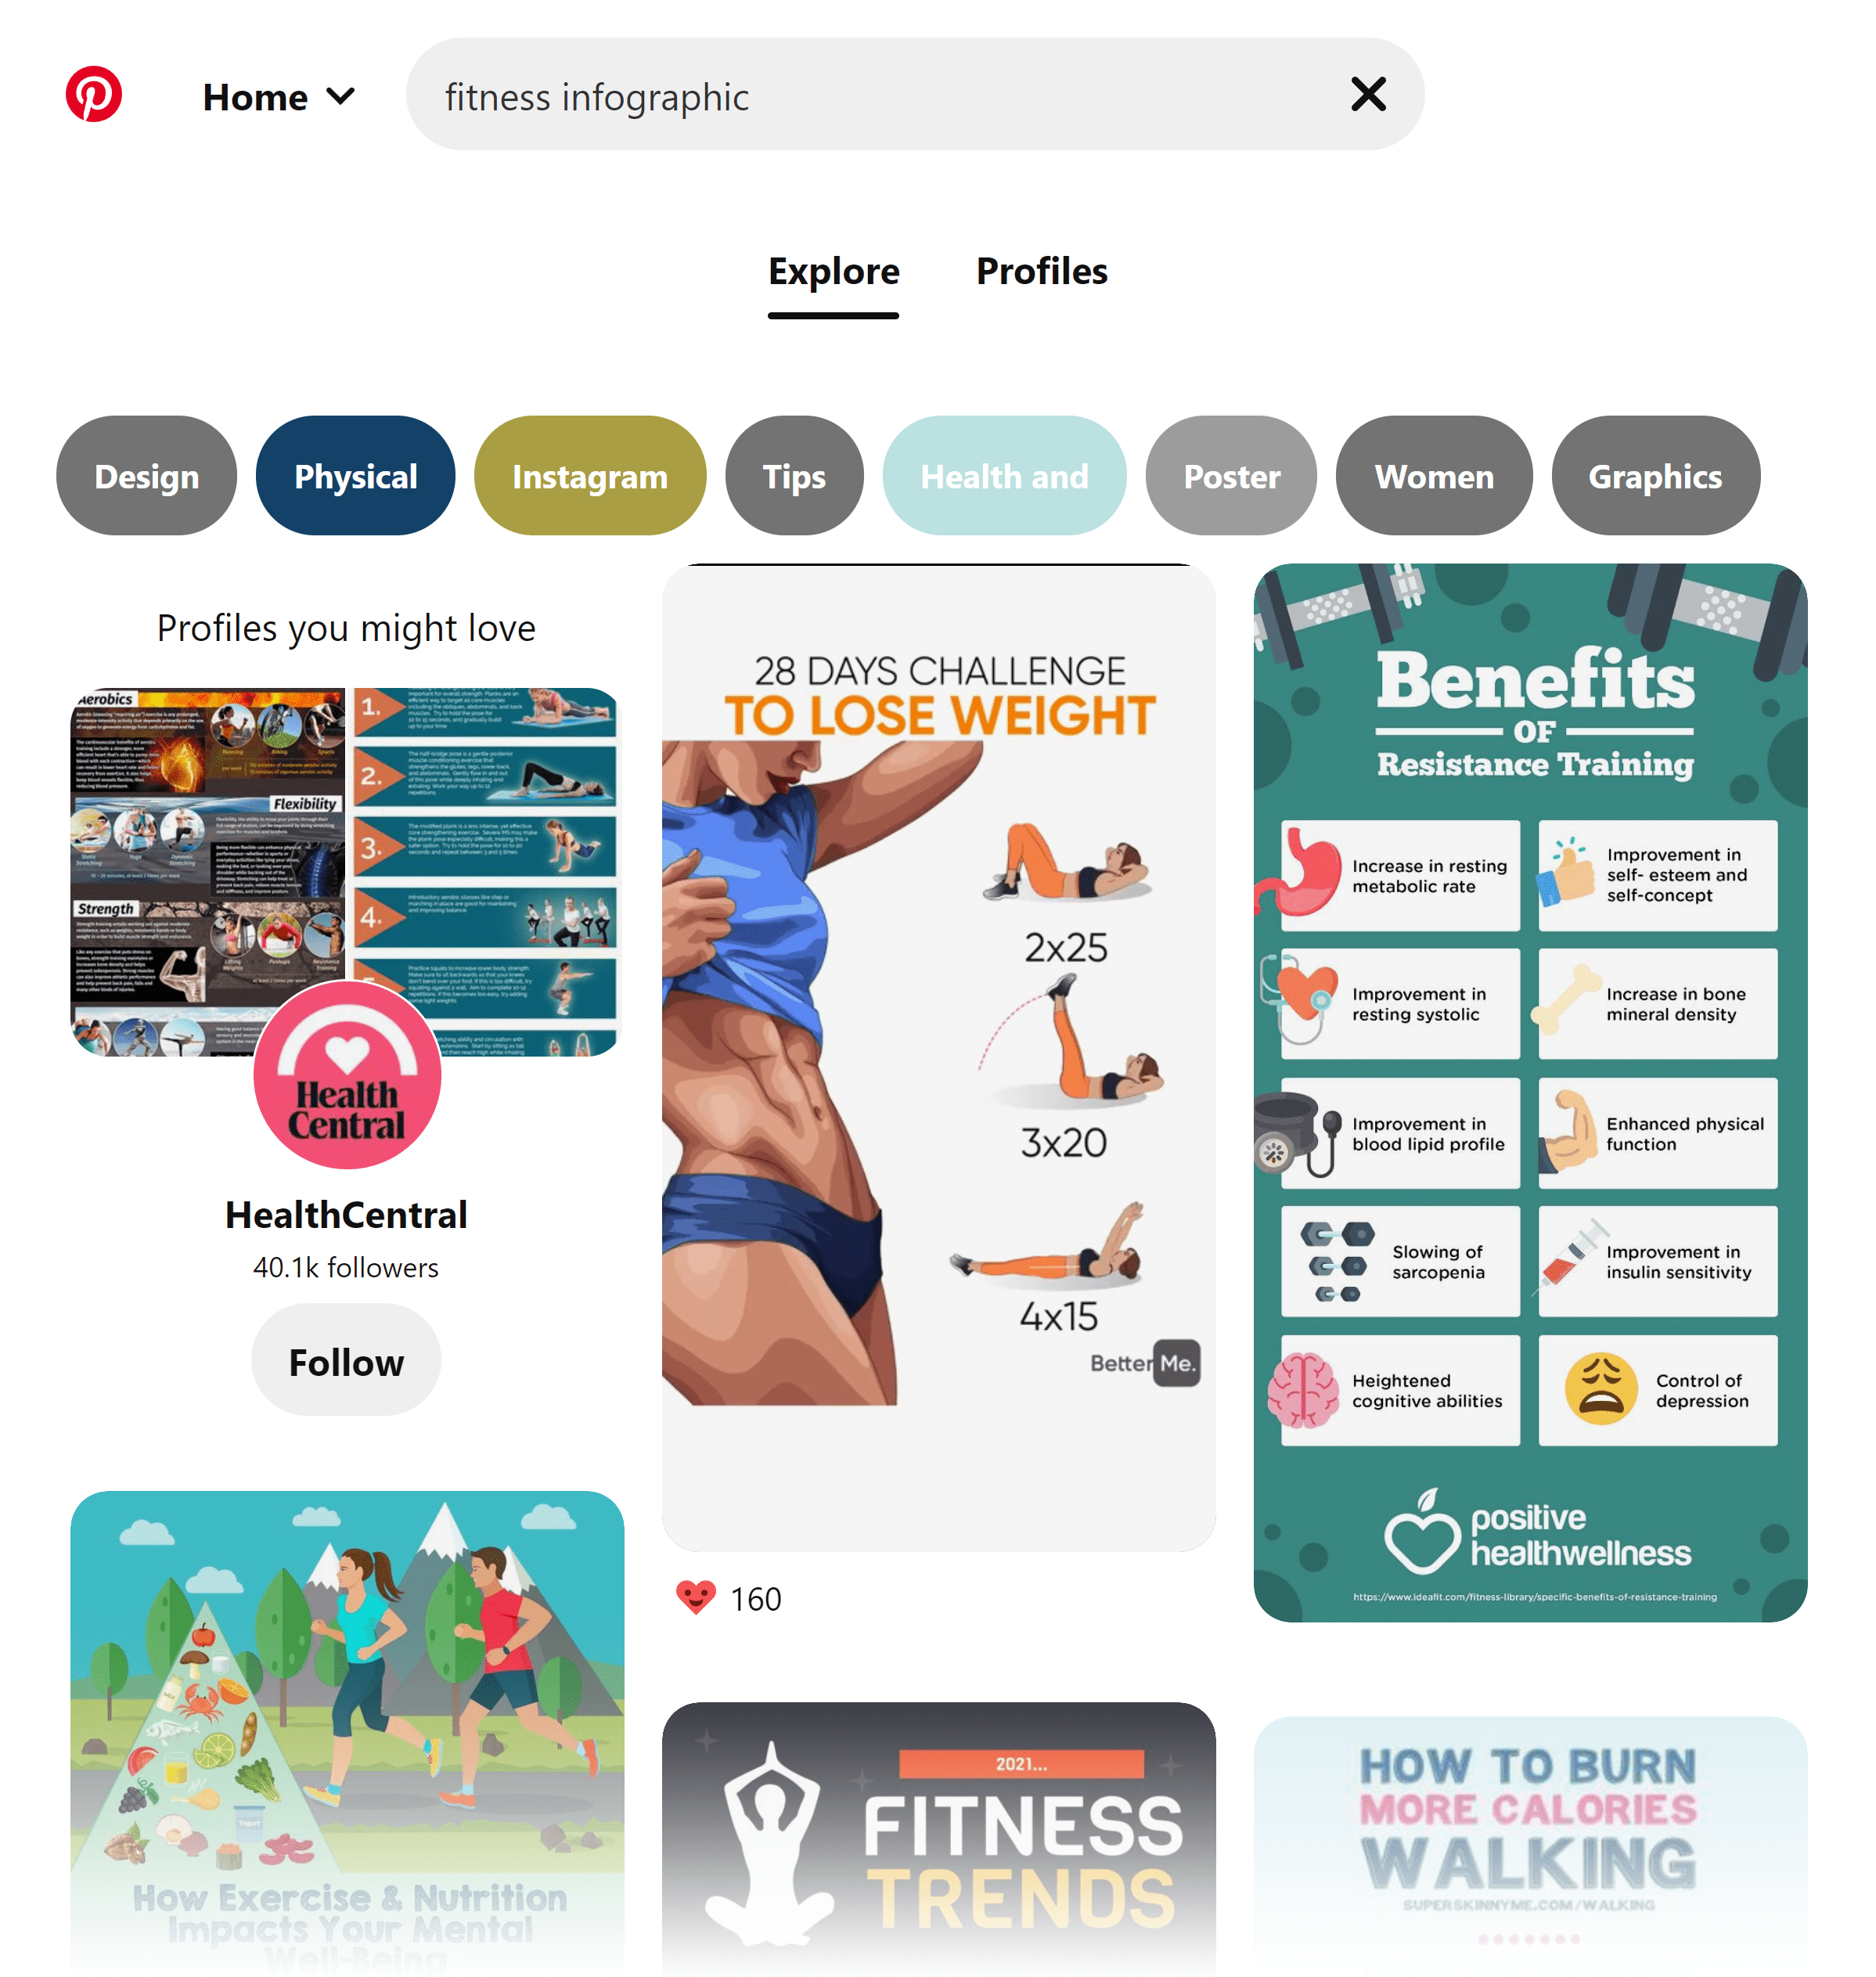
You can do the same thing using Pinterest:
3. Logical Layout
Not to turn this post into a graphic design 101 class, but there’s a BIG difference between design and layout.
And I see a lot of great infographics fail because they focus too much on design.
Here’s the difference:
Layout: How you organize and present the information (“the wireframe”).
Design: How the information looks.
Make sure that your layout:
- Has the best content at the top
- Has plenty of empty space (easier to read)
- Organizes the info as a “story” (top=Pinterest is really popular!, bottom=How to get traffic from it)
Step 2: Simple (But Effective) Link Prospecting
Now that you have your infographic published on your site, it’s time to find your link targets.
With my infographic, I was looking for sites that had already published content about on-page SEO.
To find them, I just searched Google for things like “on page SEO”, “on page seo tips” and anything else that Google Suggest came up with:
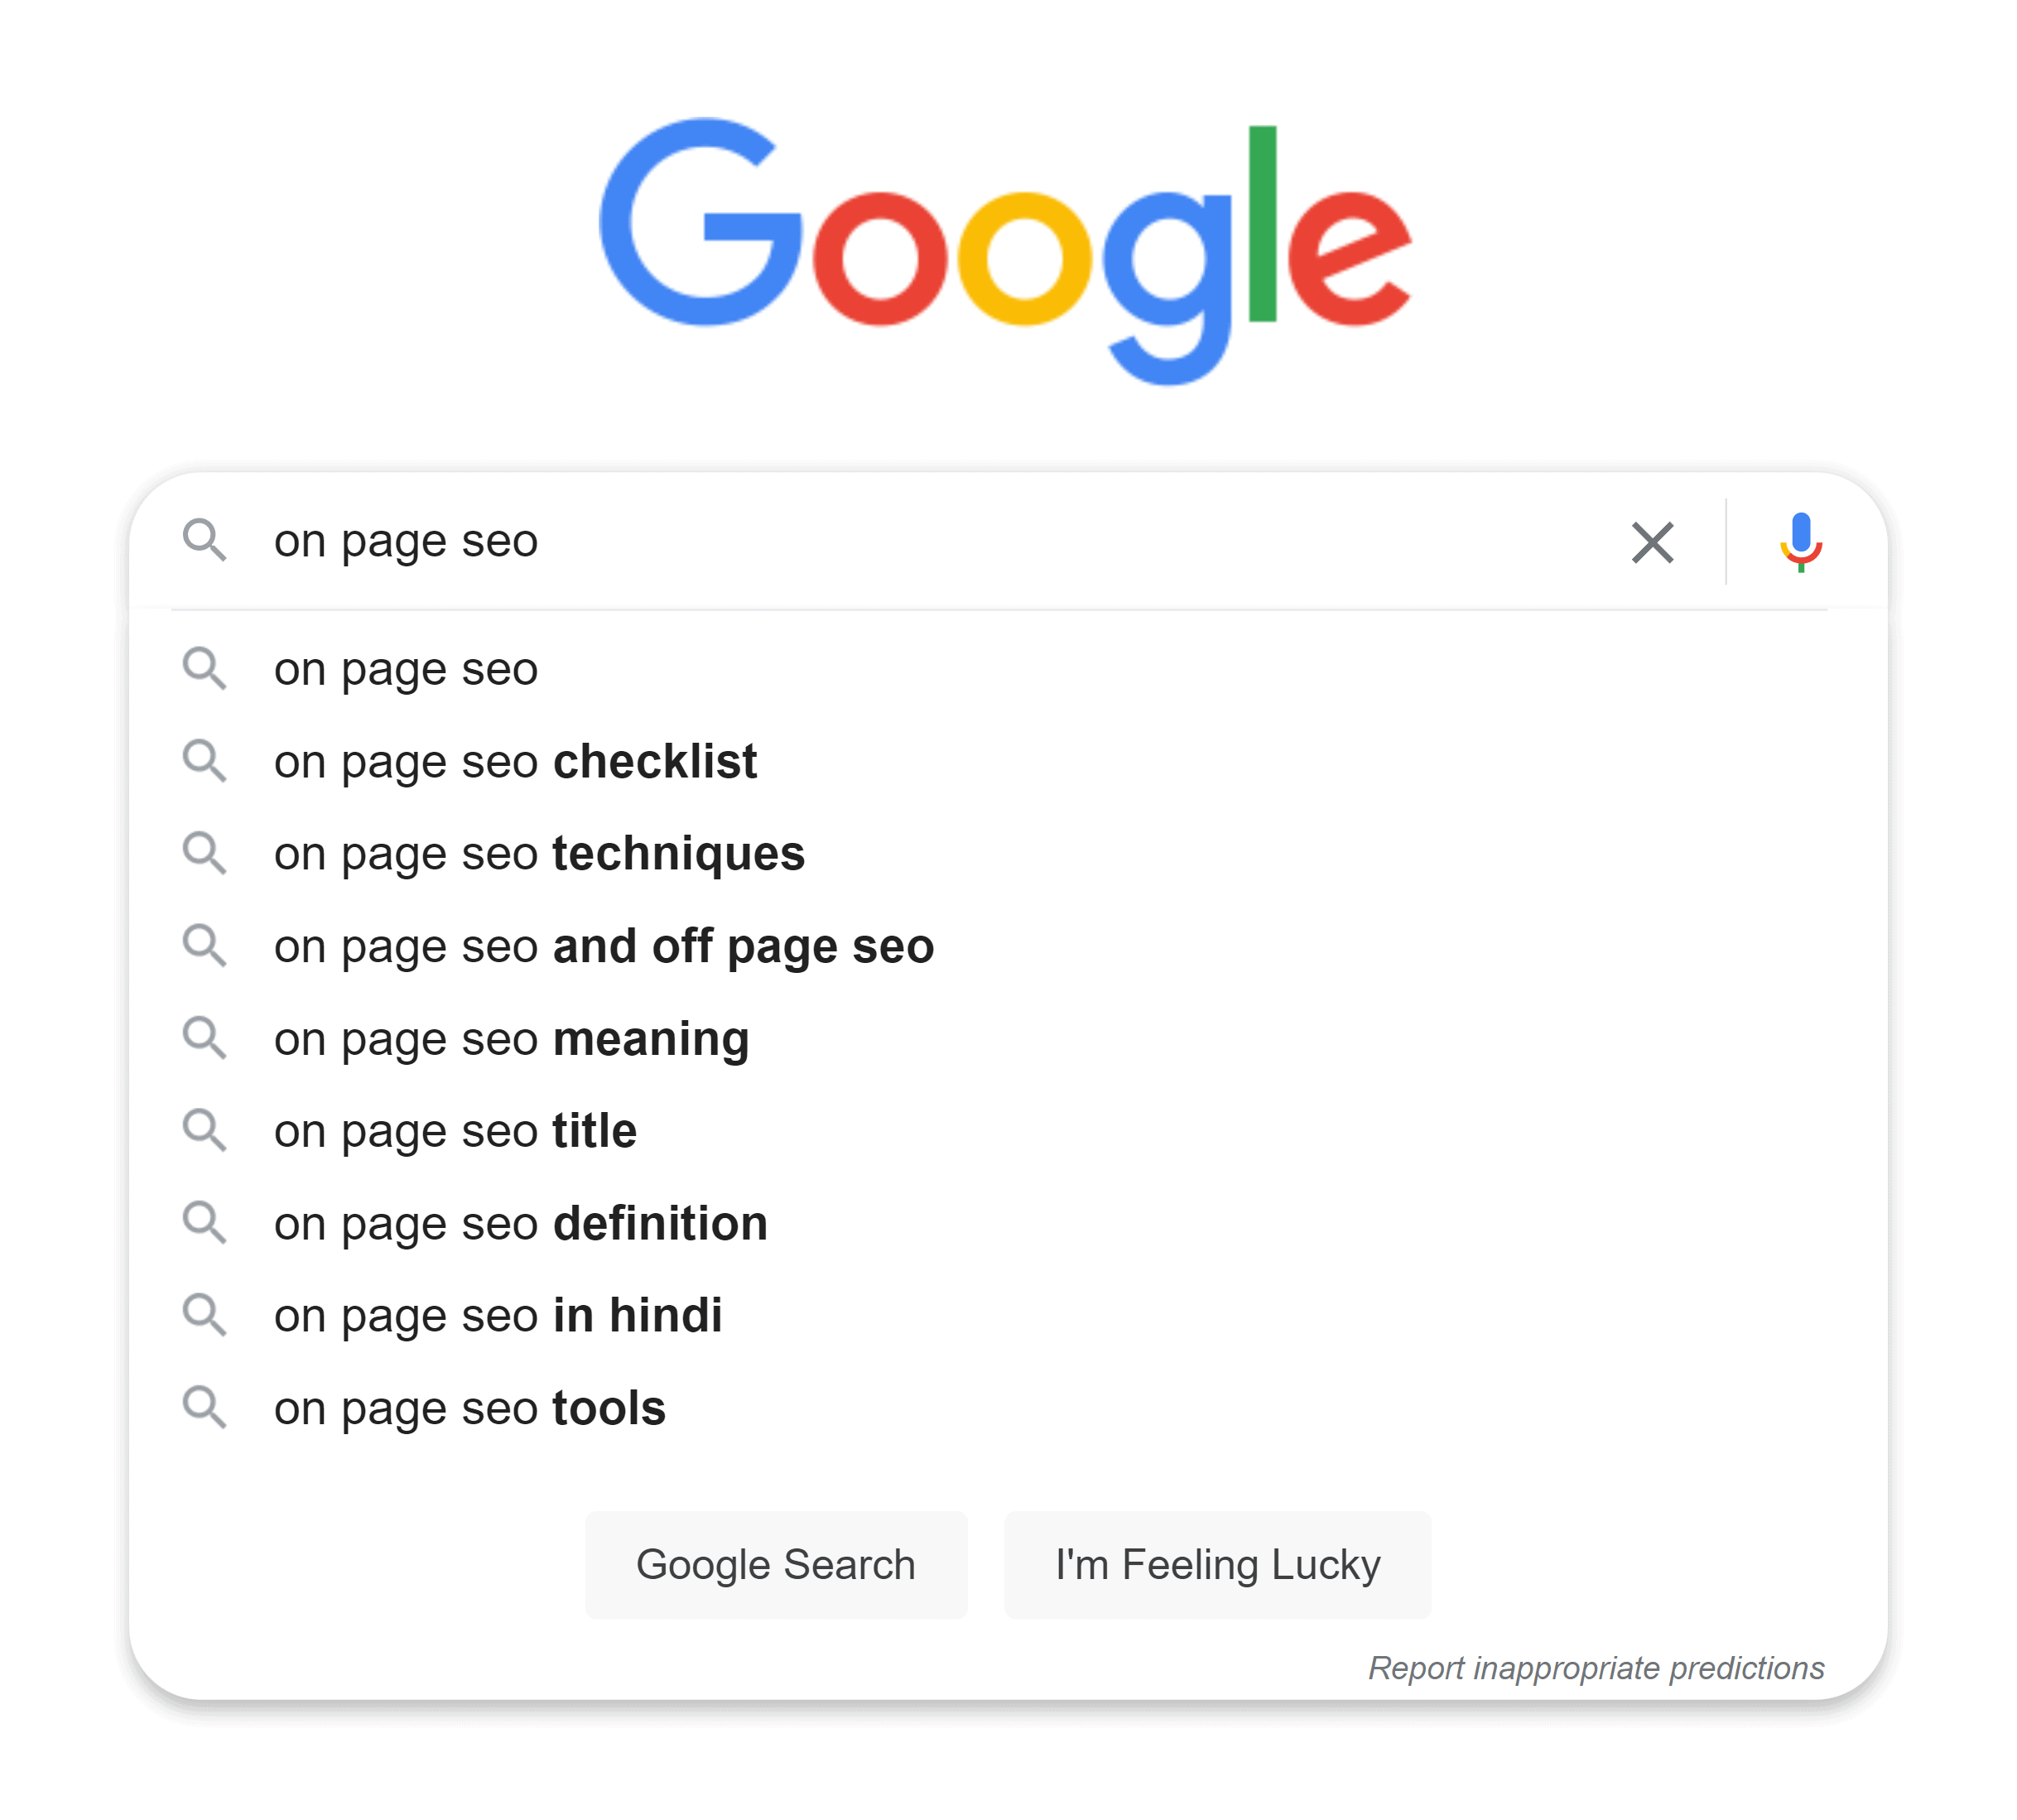
Another example: if you had a site about gluten free cooking, you could search for things like “gluten free baking”, “gluten free recipes” etc.
Easy, right?
Step 3: Show Them Your Infographic
When I found a site in the results that looked promising, I sent them this email (yes, this is the actual email I sent out).
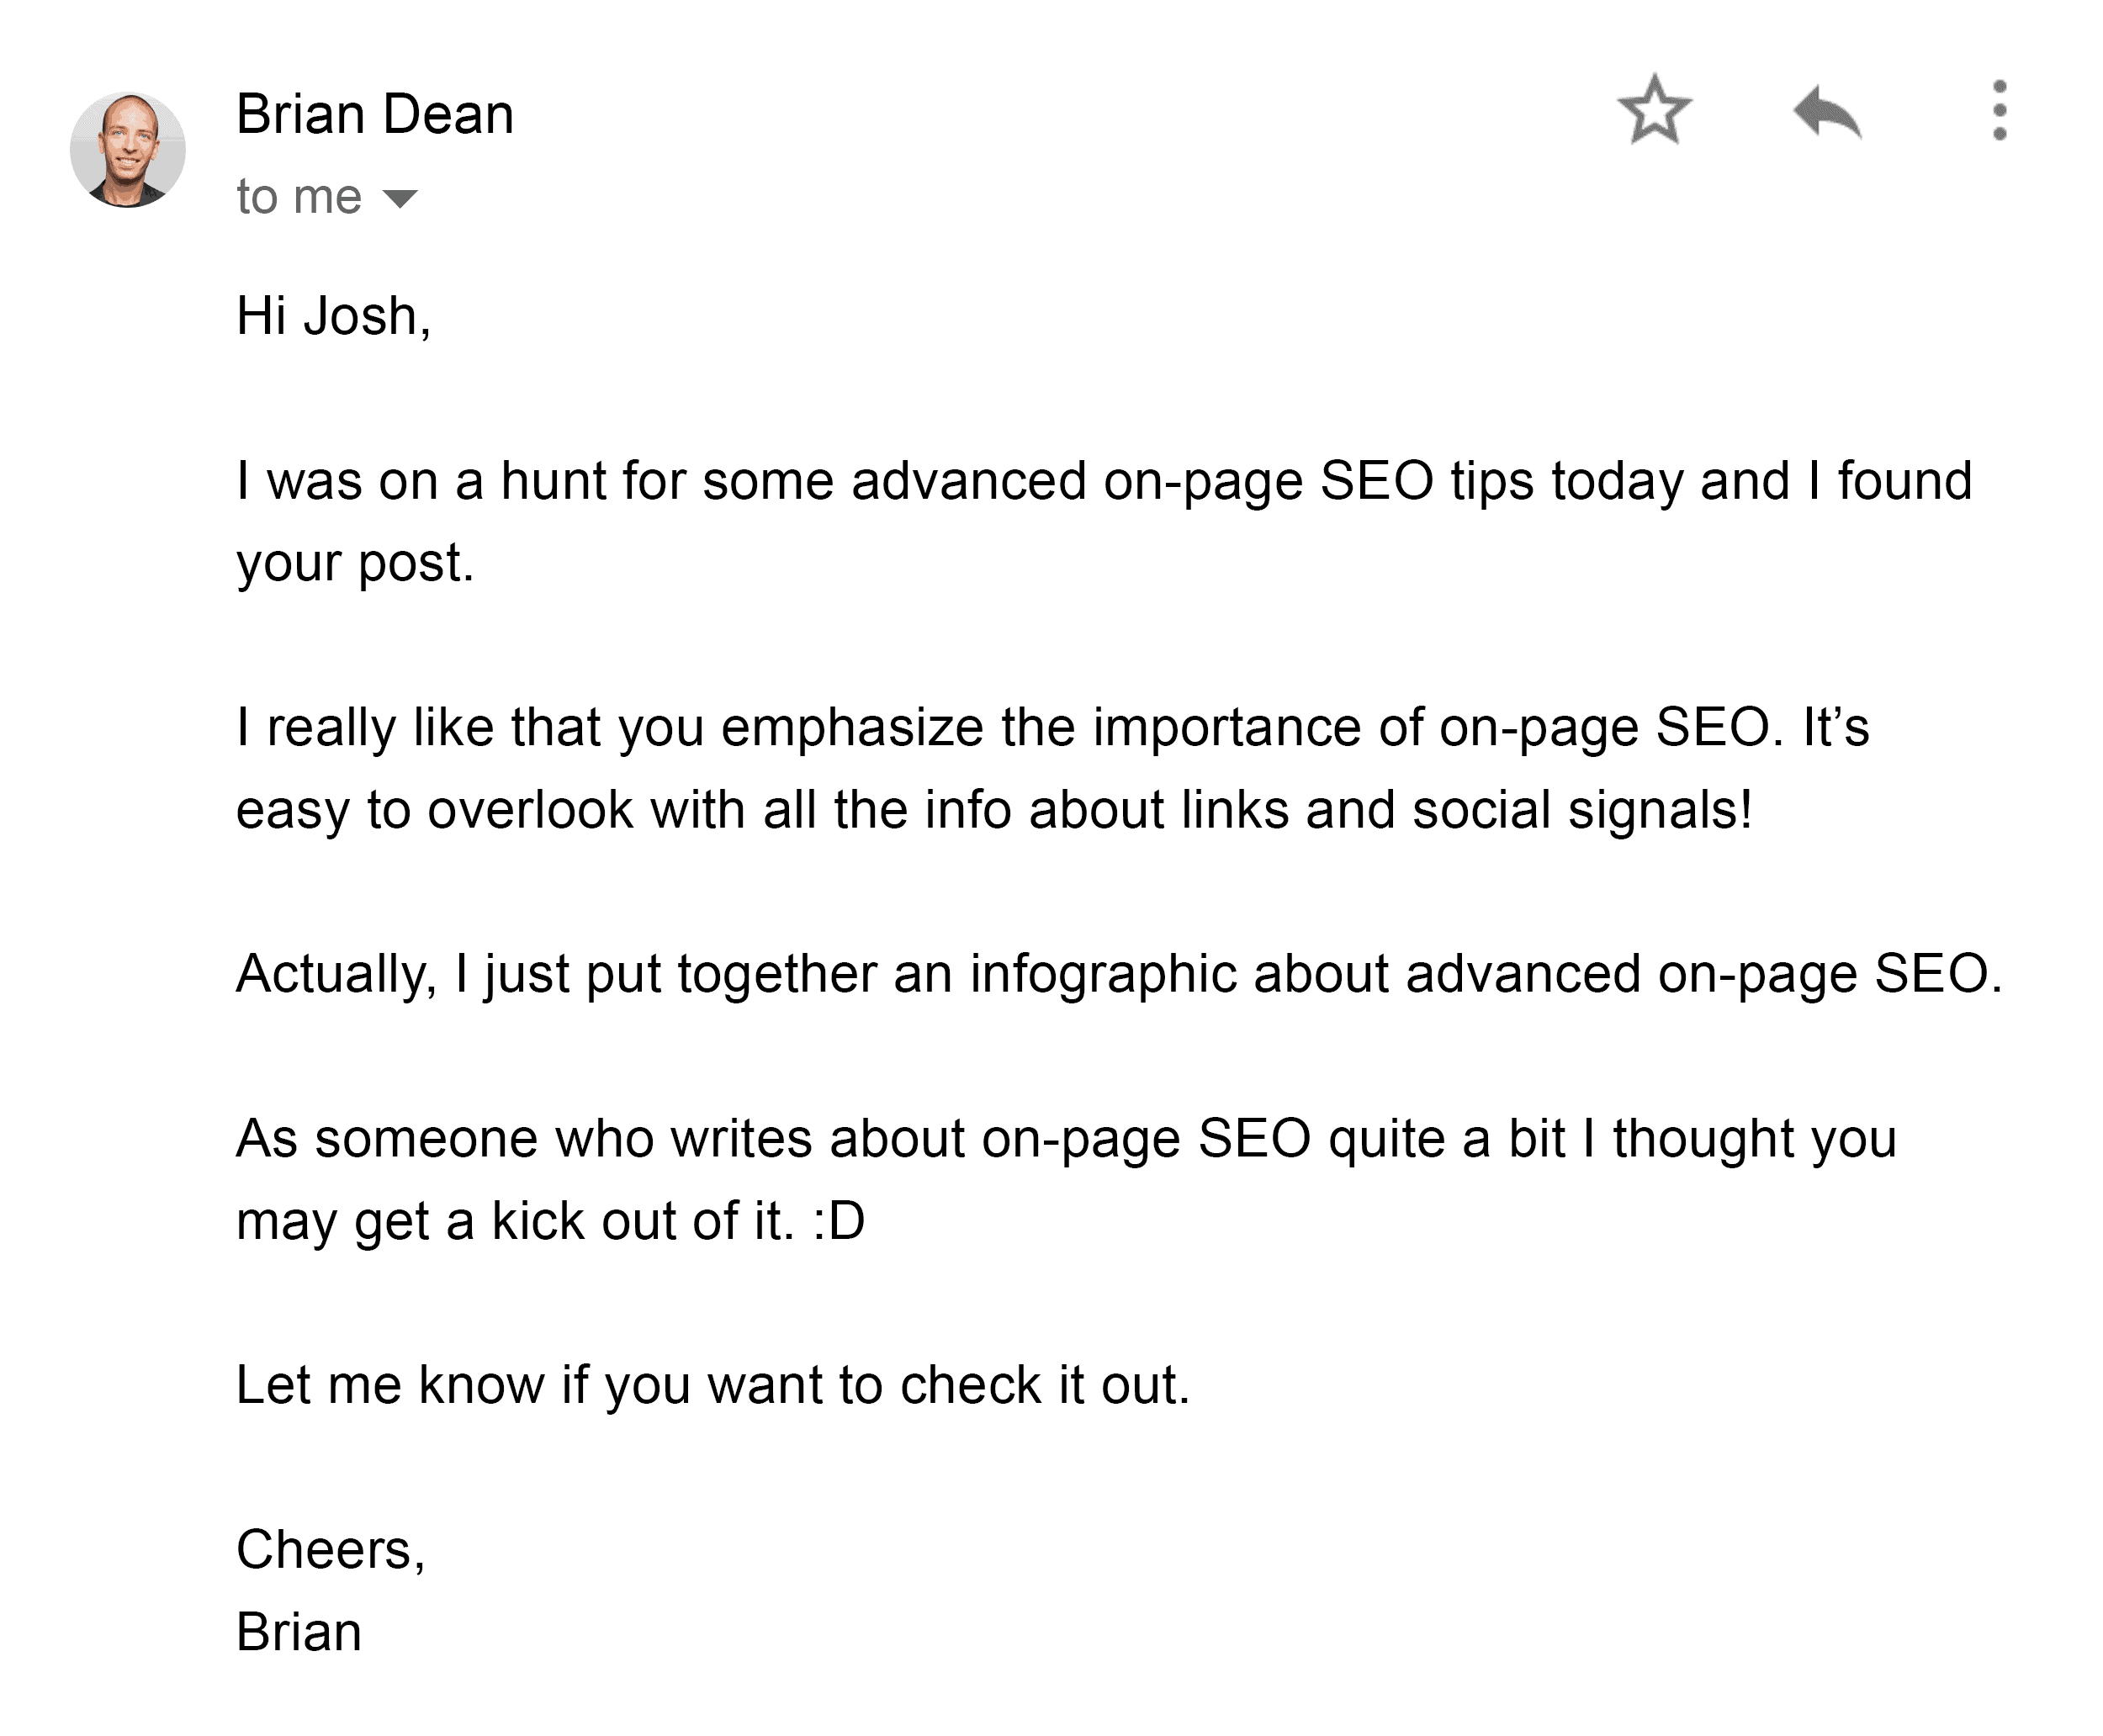
Here’s why this script worked really well for me:
- Personalized: includes their name and site name
- Short: less than 90 words
- Soft sell: only asks if they want to see the infographic
Step 4: Bribe Your Prospects With Free Content
Here’s where things get very interesting…
When most people pitch an infographic, they get on their knees and beg.
Remember: when you’re doing email outreach, you need to add value to that person’s site.
And begging doesn’t count. 🙂
With the Guestographic Method, you’re offering them a free “mini guest post” to go along with the infographic.
That way you’re providing value three times:
- Showing them a cool infographic on a topic that they’re interested in
- Letting them share that content with their audience, who is also interested in that topic
- Giving them free content to complement the infographic
Here’s the email that I sent to people that replied to my first message:
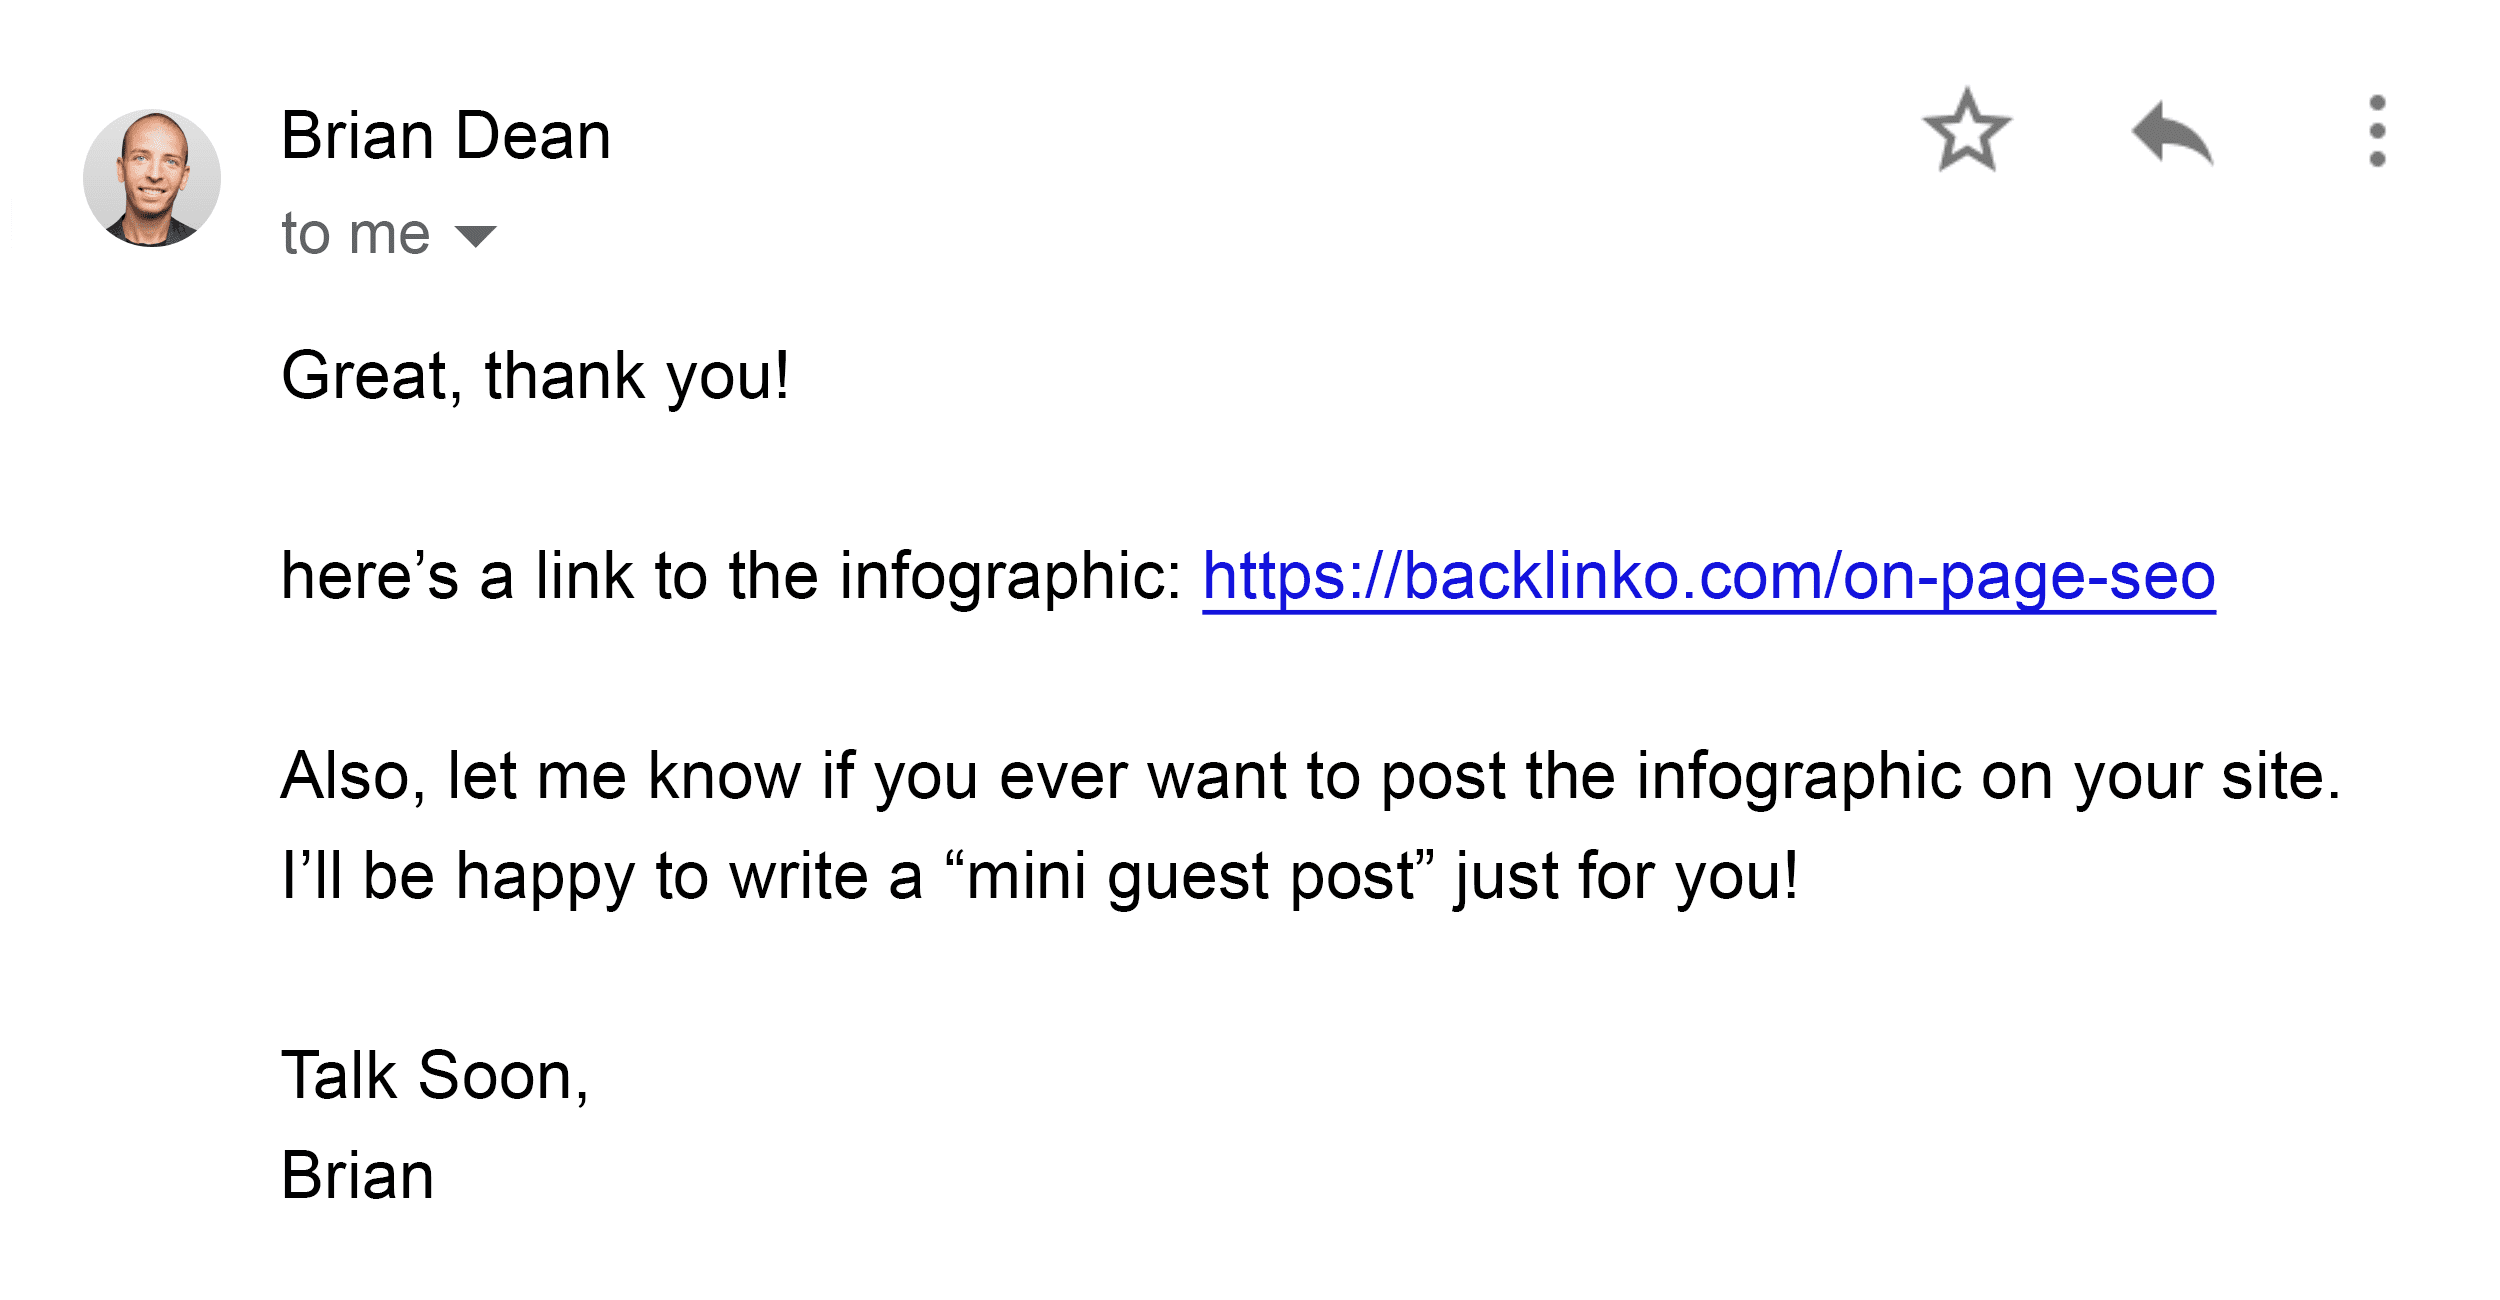
When they got back to me saying “sure”, I wrote a top-notch 250-300 word introduction tailored to their site.
Step 5: Get Your Contextual Links
You may have heard that Google may devalue backlinks coming from infographics.
But if you read the interview, you’ll notice that they were referring to “embed links”, like this:
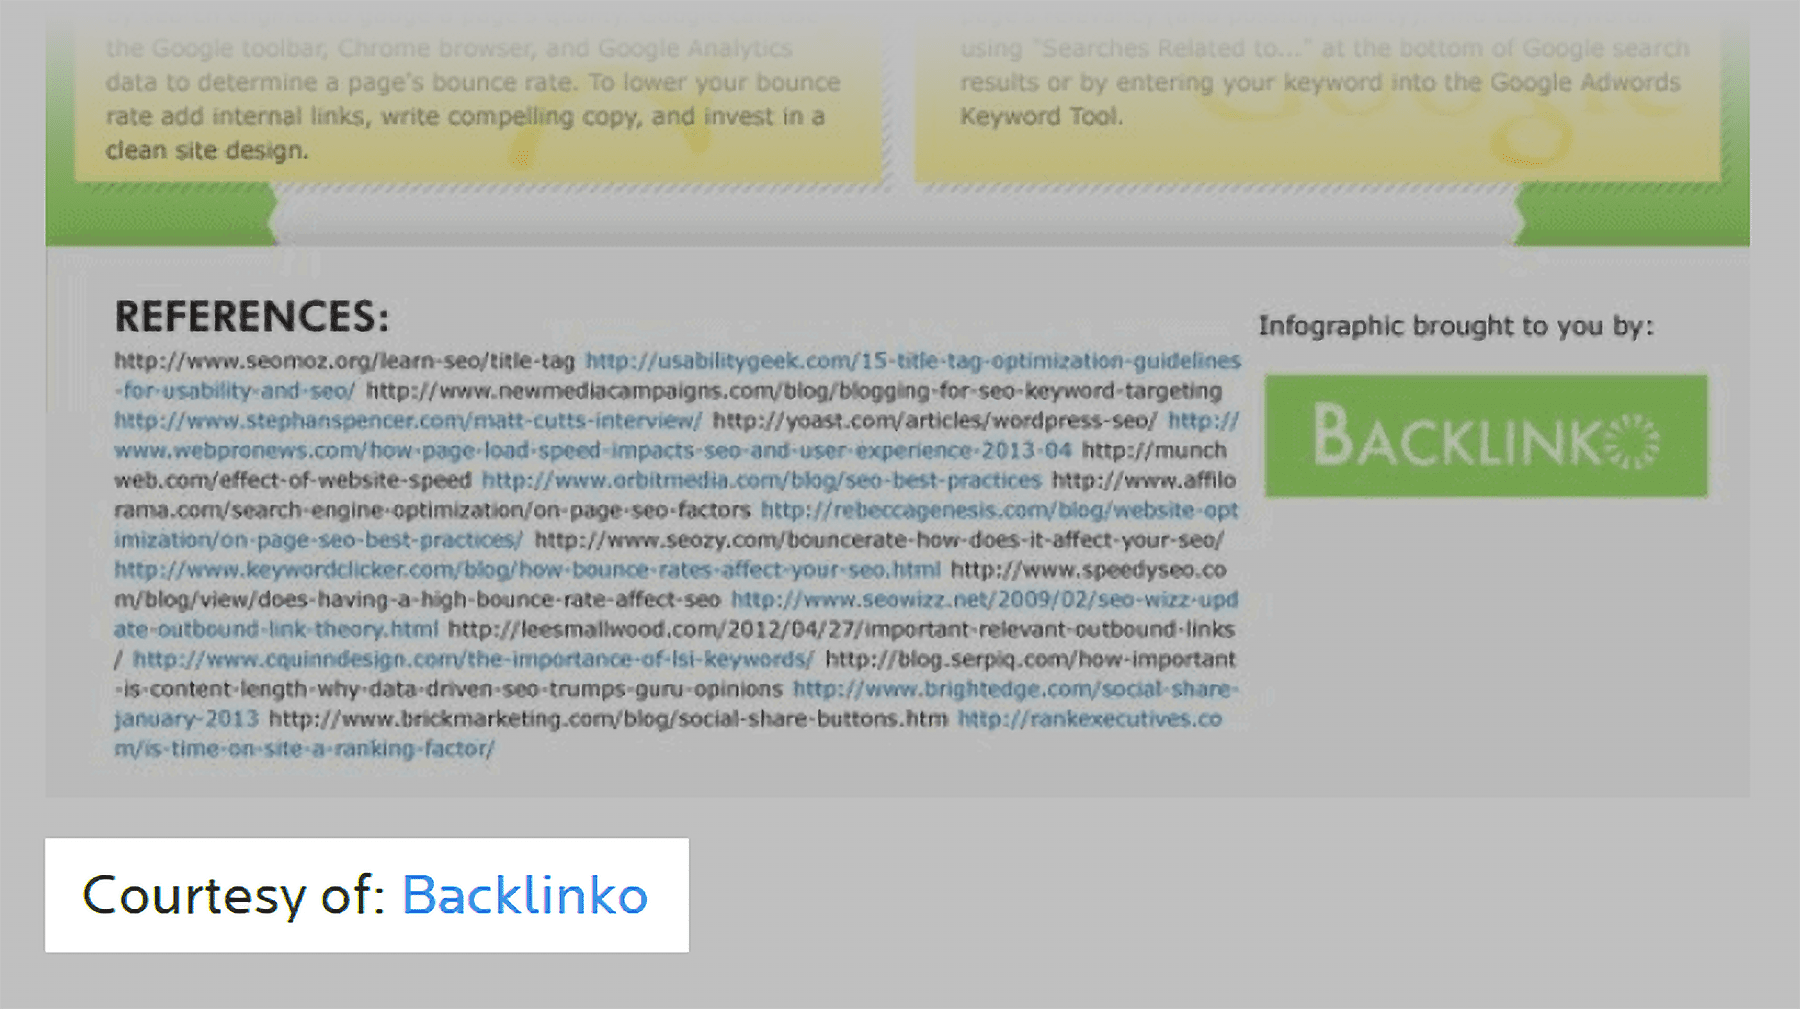
These links appear automatically when someone embeds an infographic on their site. These are the same types of semi-automatic links that Google doesn’t like.
What’s great about the Guestographic Method is that you get backlinks surrounded by relevant content…
…not an embed link buried at the bottom of a page.
Here’s an example of a contextual link from a Guestographic that I published a while ago:
That contextual link is MUCH more powerful than an embed link.